| All of the Desert Research Institute Western Regional Climate Center Weather Sites | click here | |
| LOCAL WEATHER STATION DATA MANAGED BY THE WESTERN REGIONAL CLIMATE CENTER AT DRI | SITE DESCRIPTION | Current Data Graphs to see what's going on |
| UNR Weather Station on Valley Road | click here Photograph and Video |
Be careful interpreting the timing of snow precip amount. |
| DRI Weather Station | click here |
click here |
| Slide Mountain Weather Station | click here | click here |
|
|
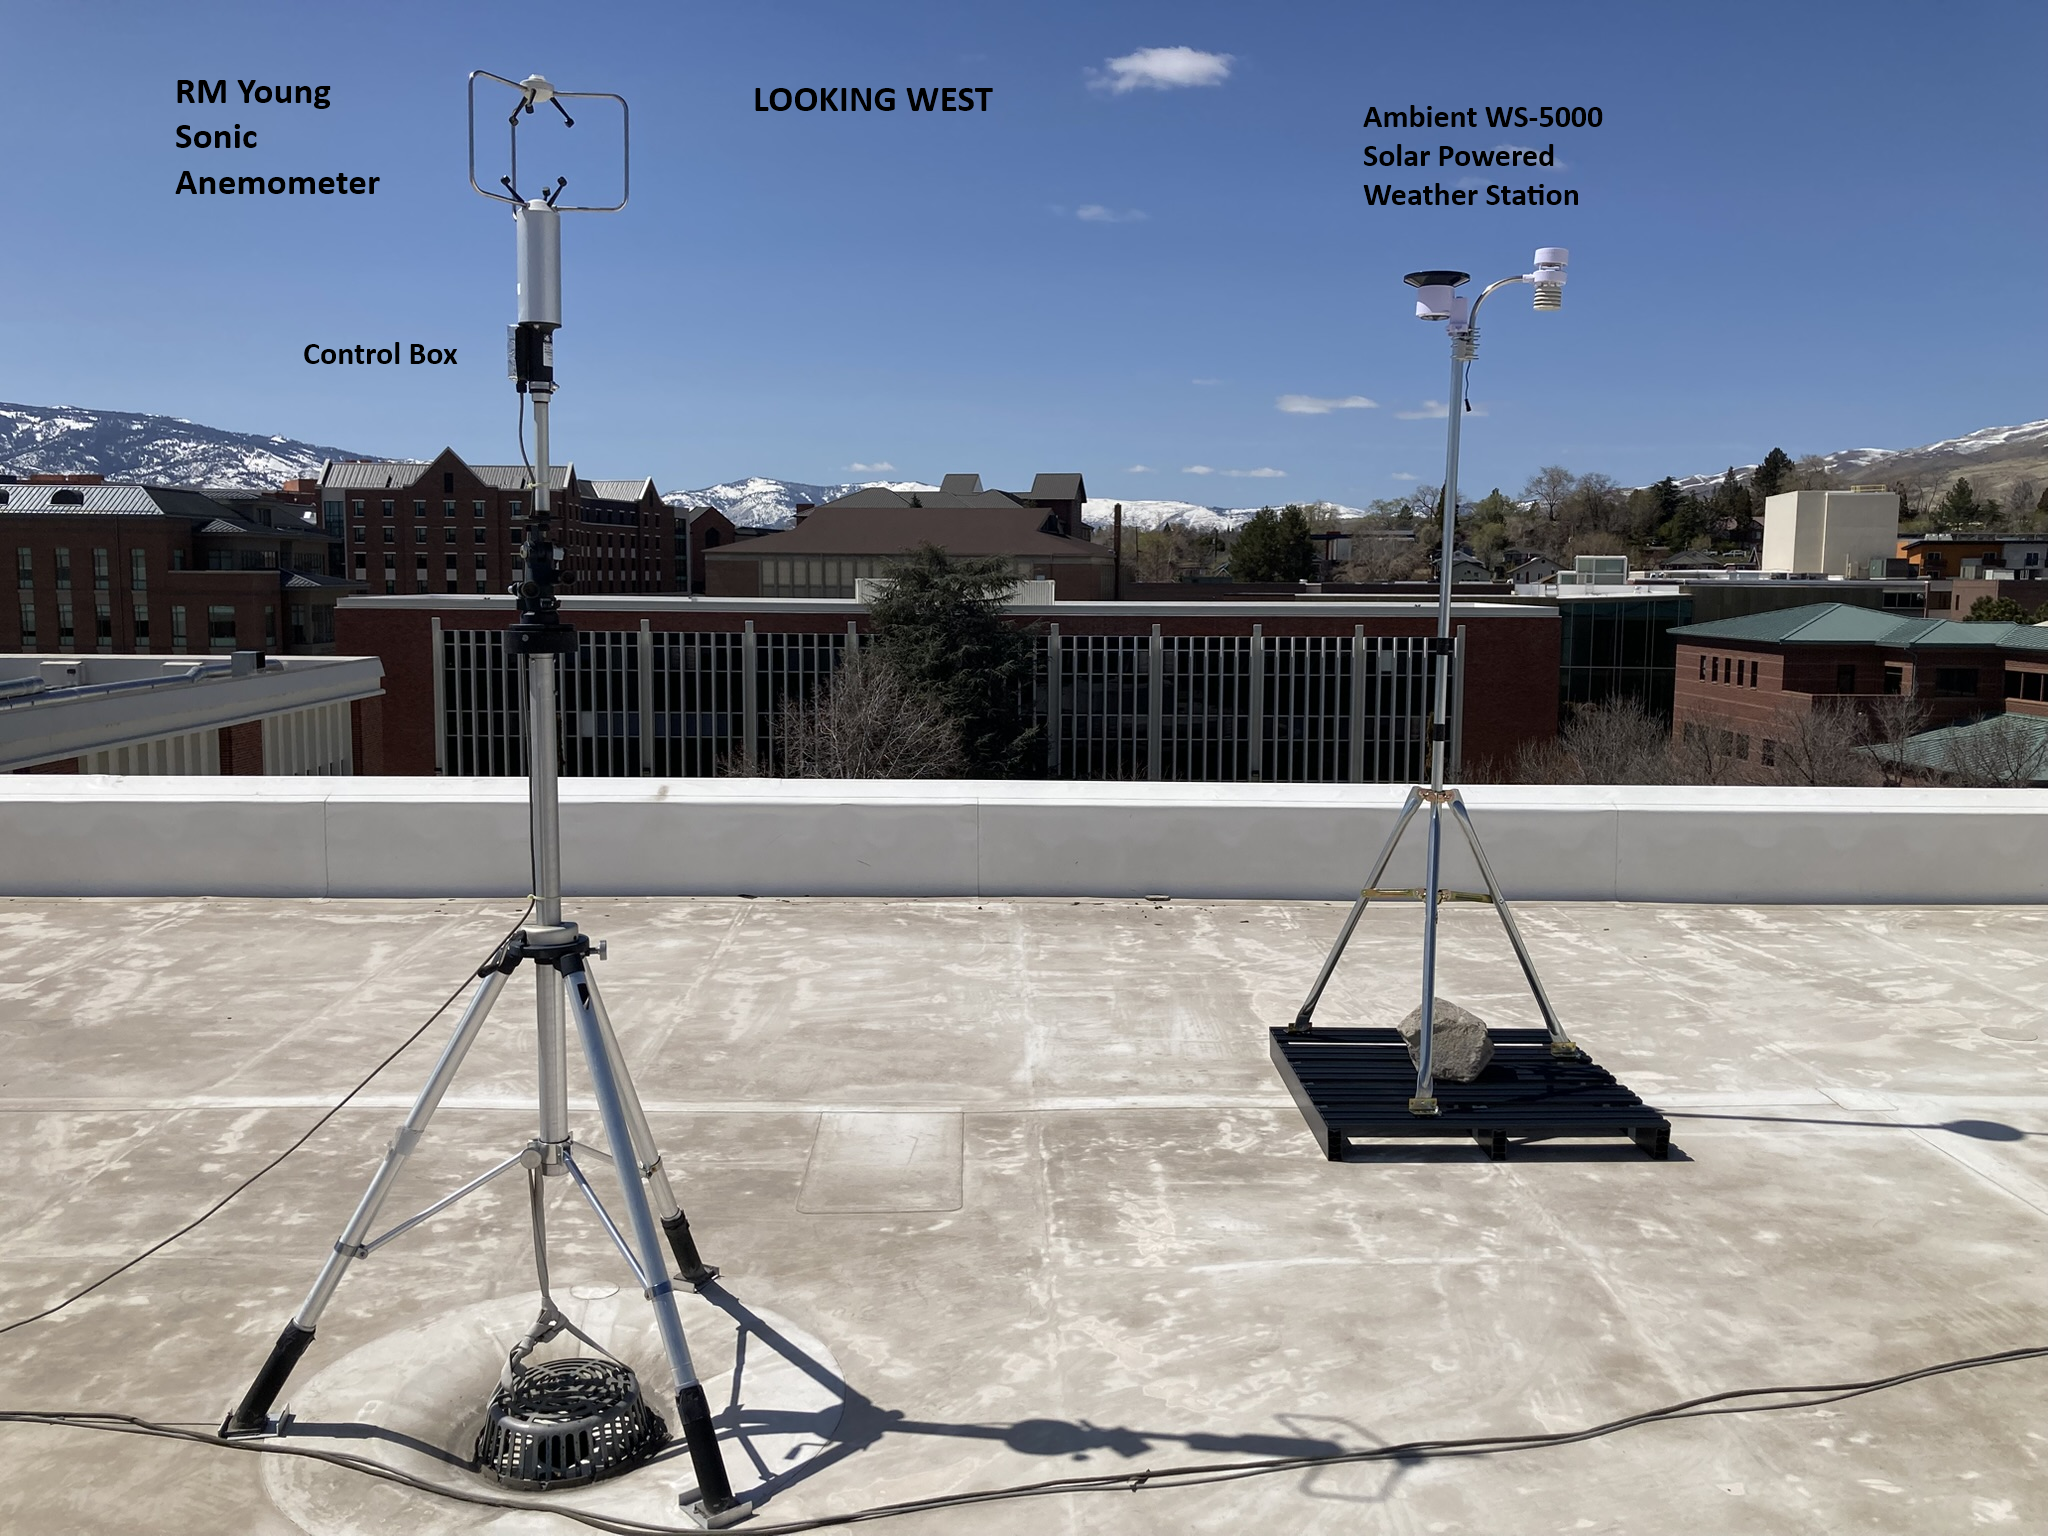
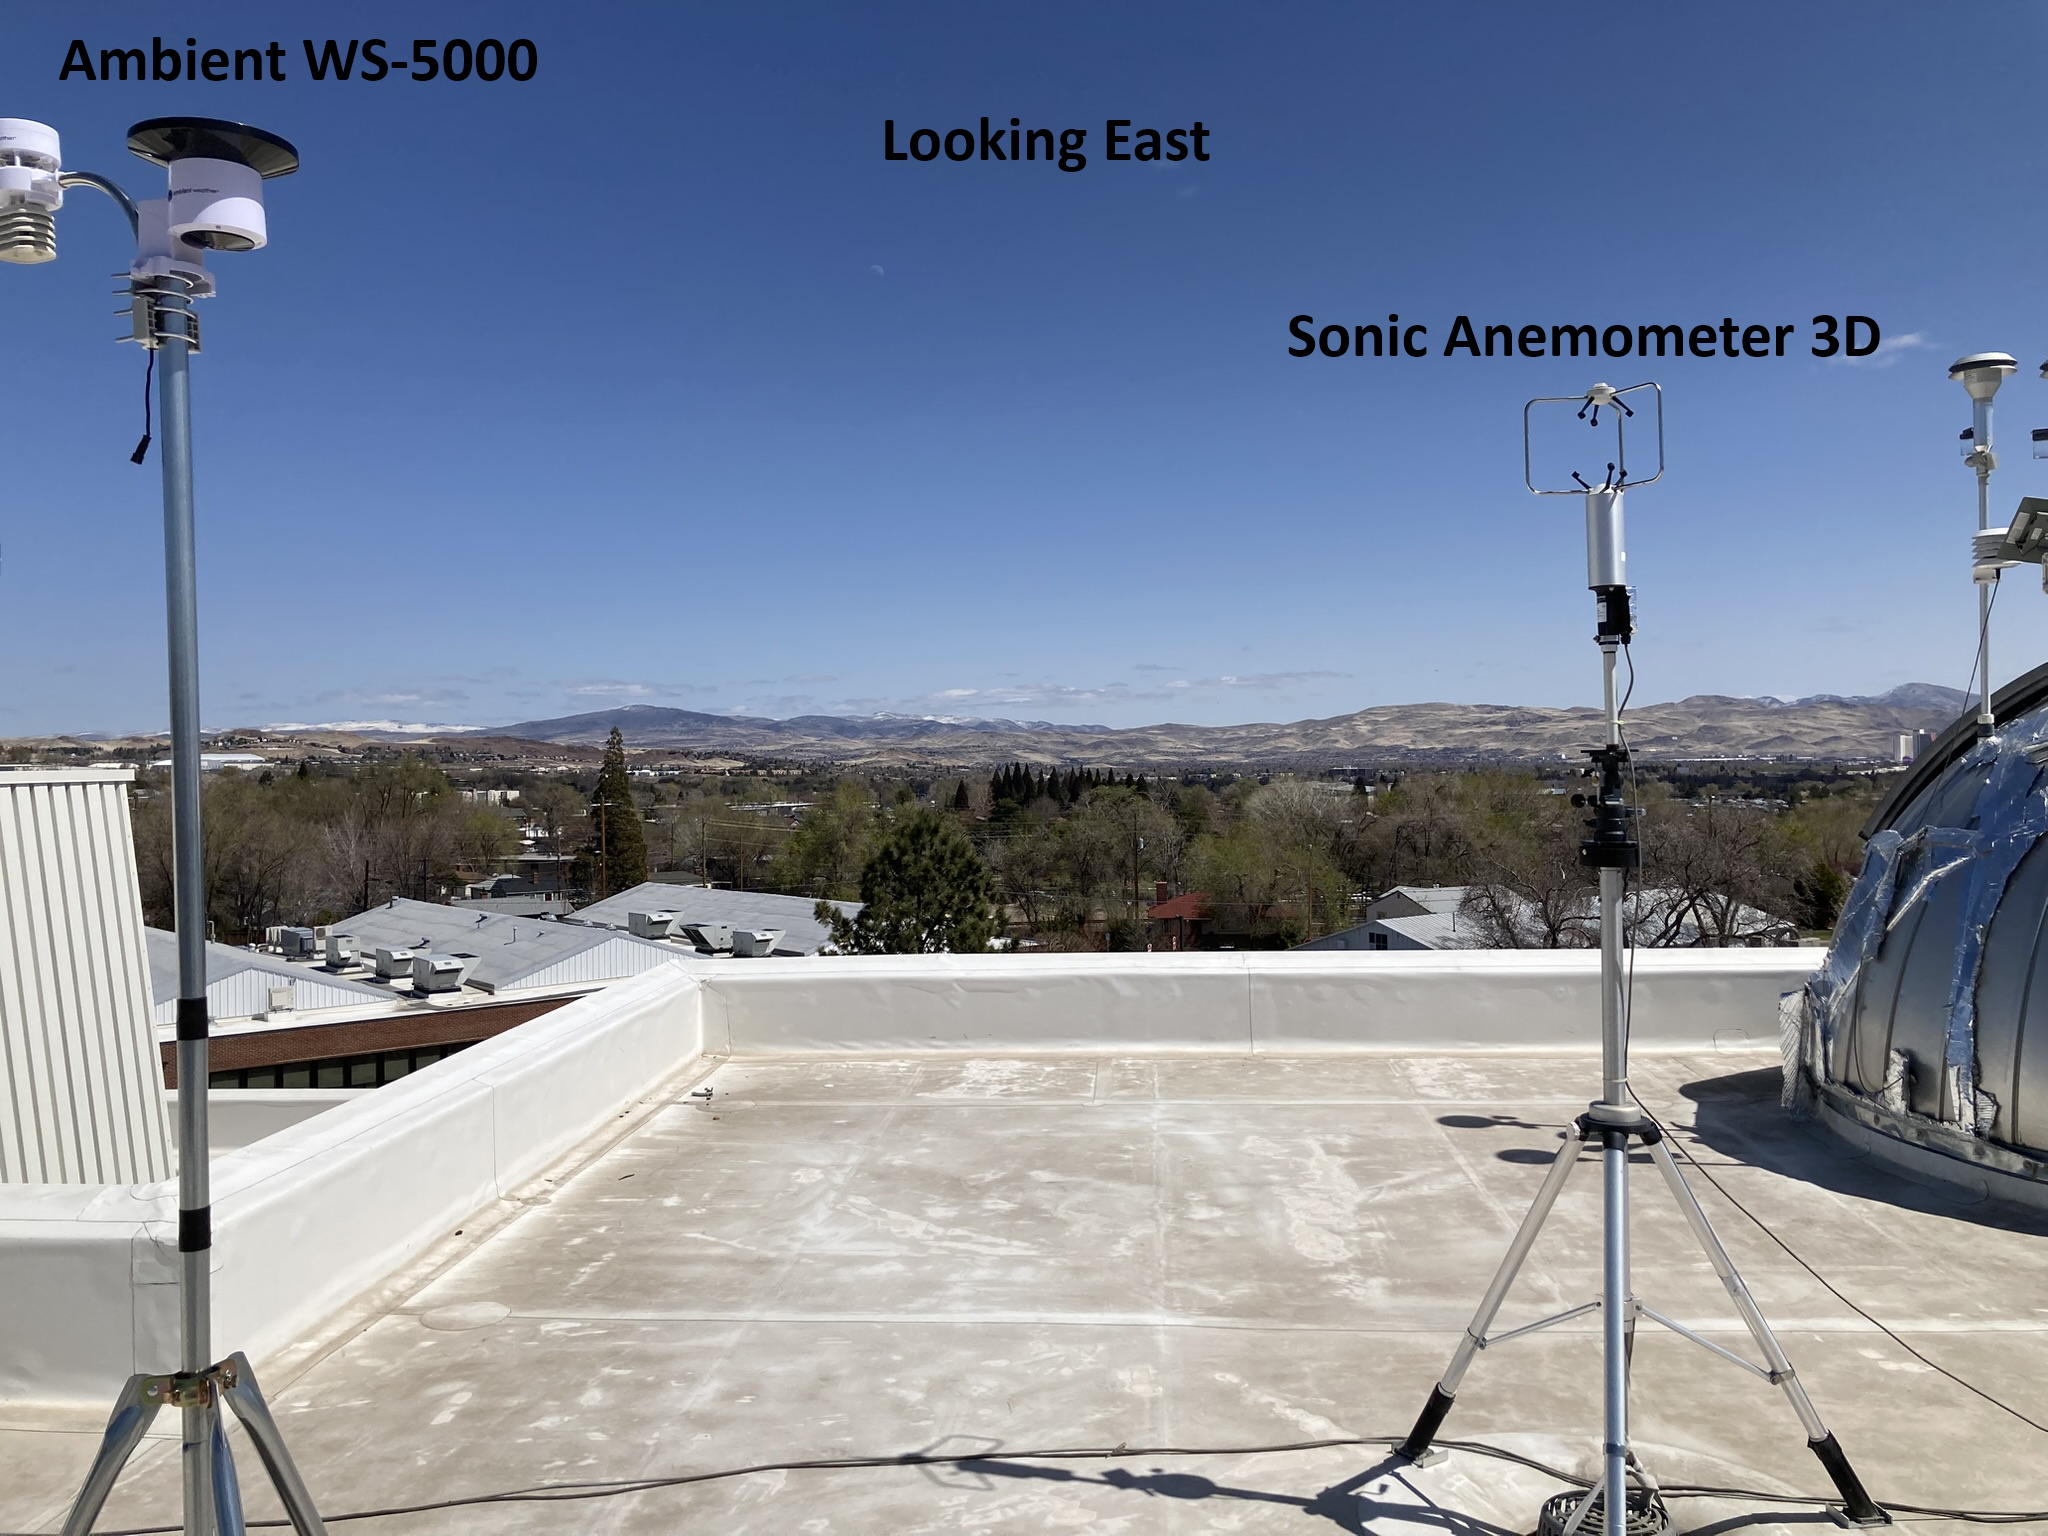
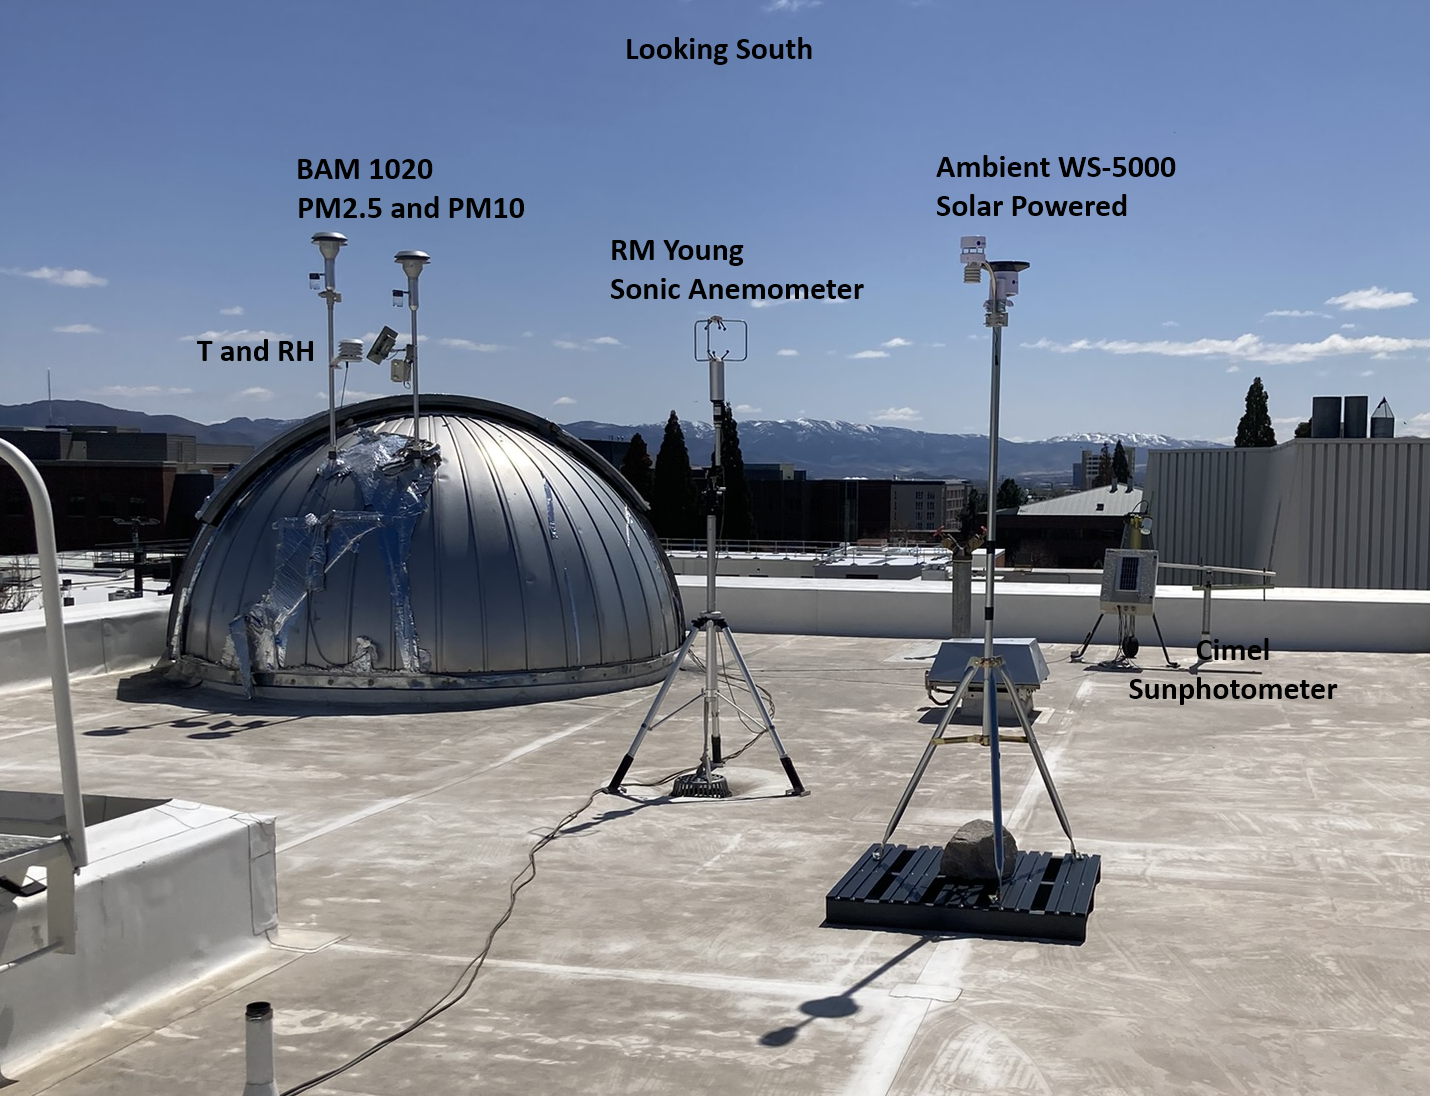
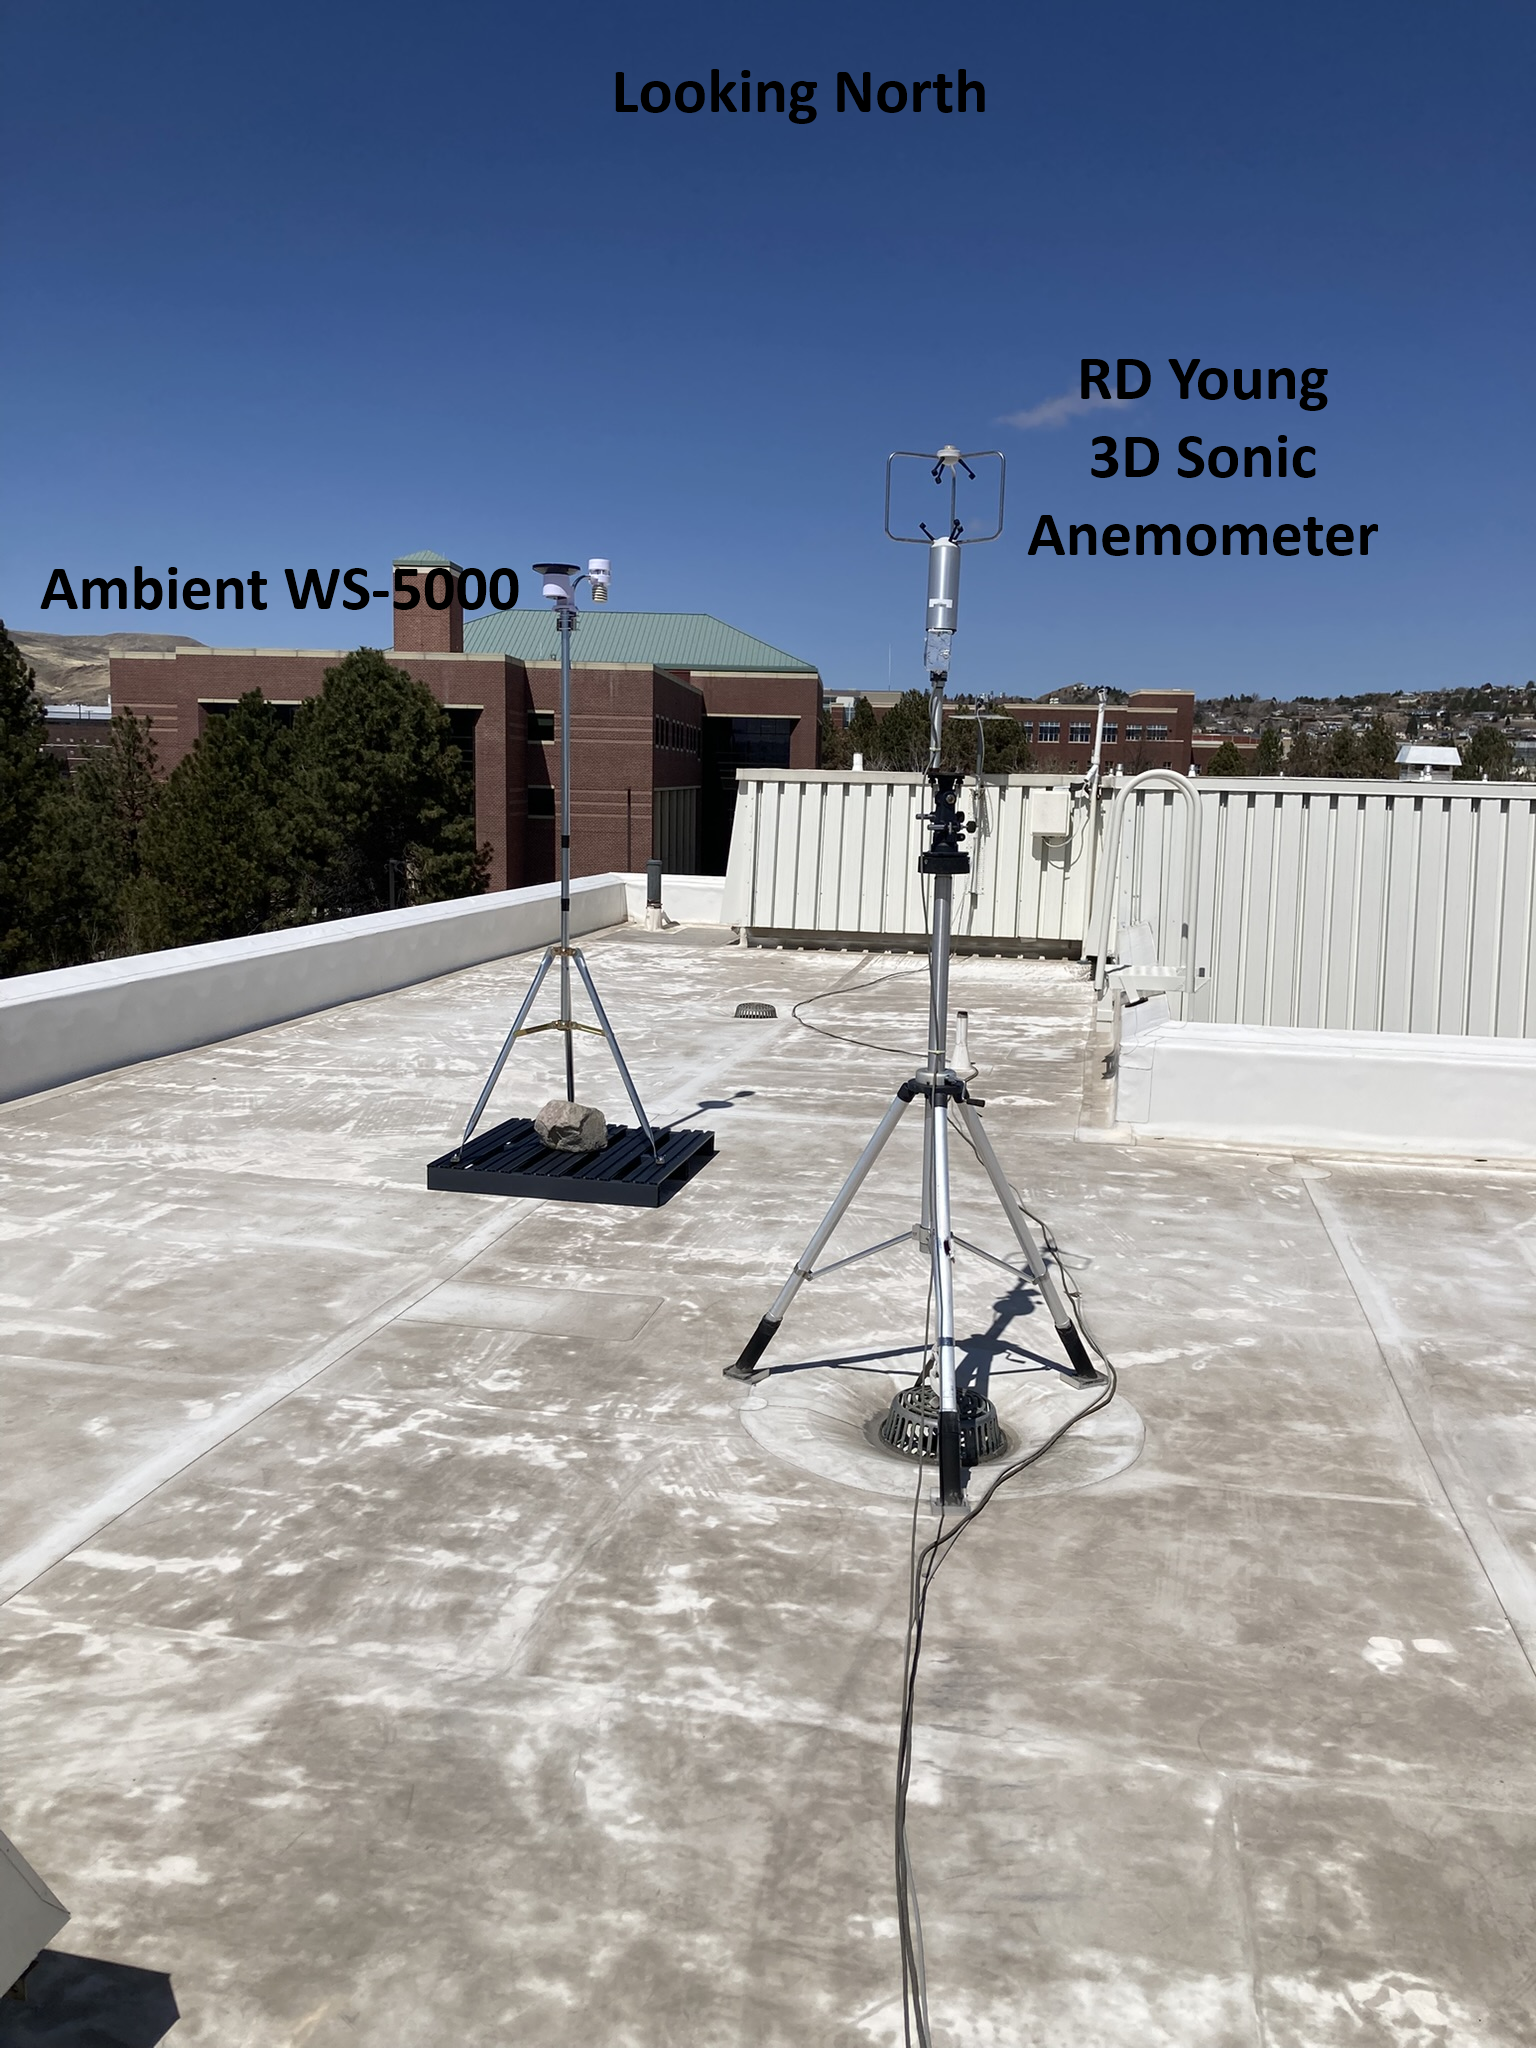
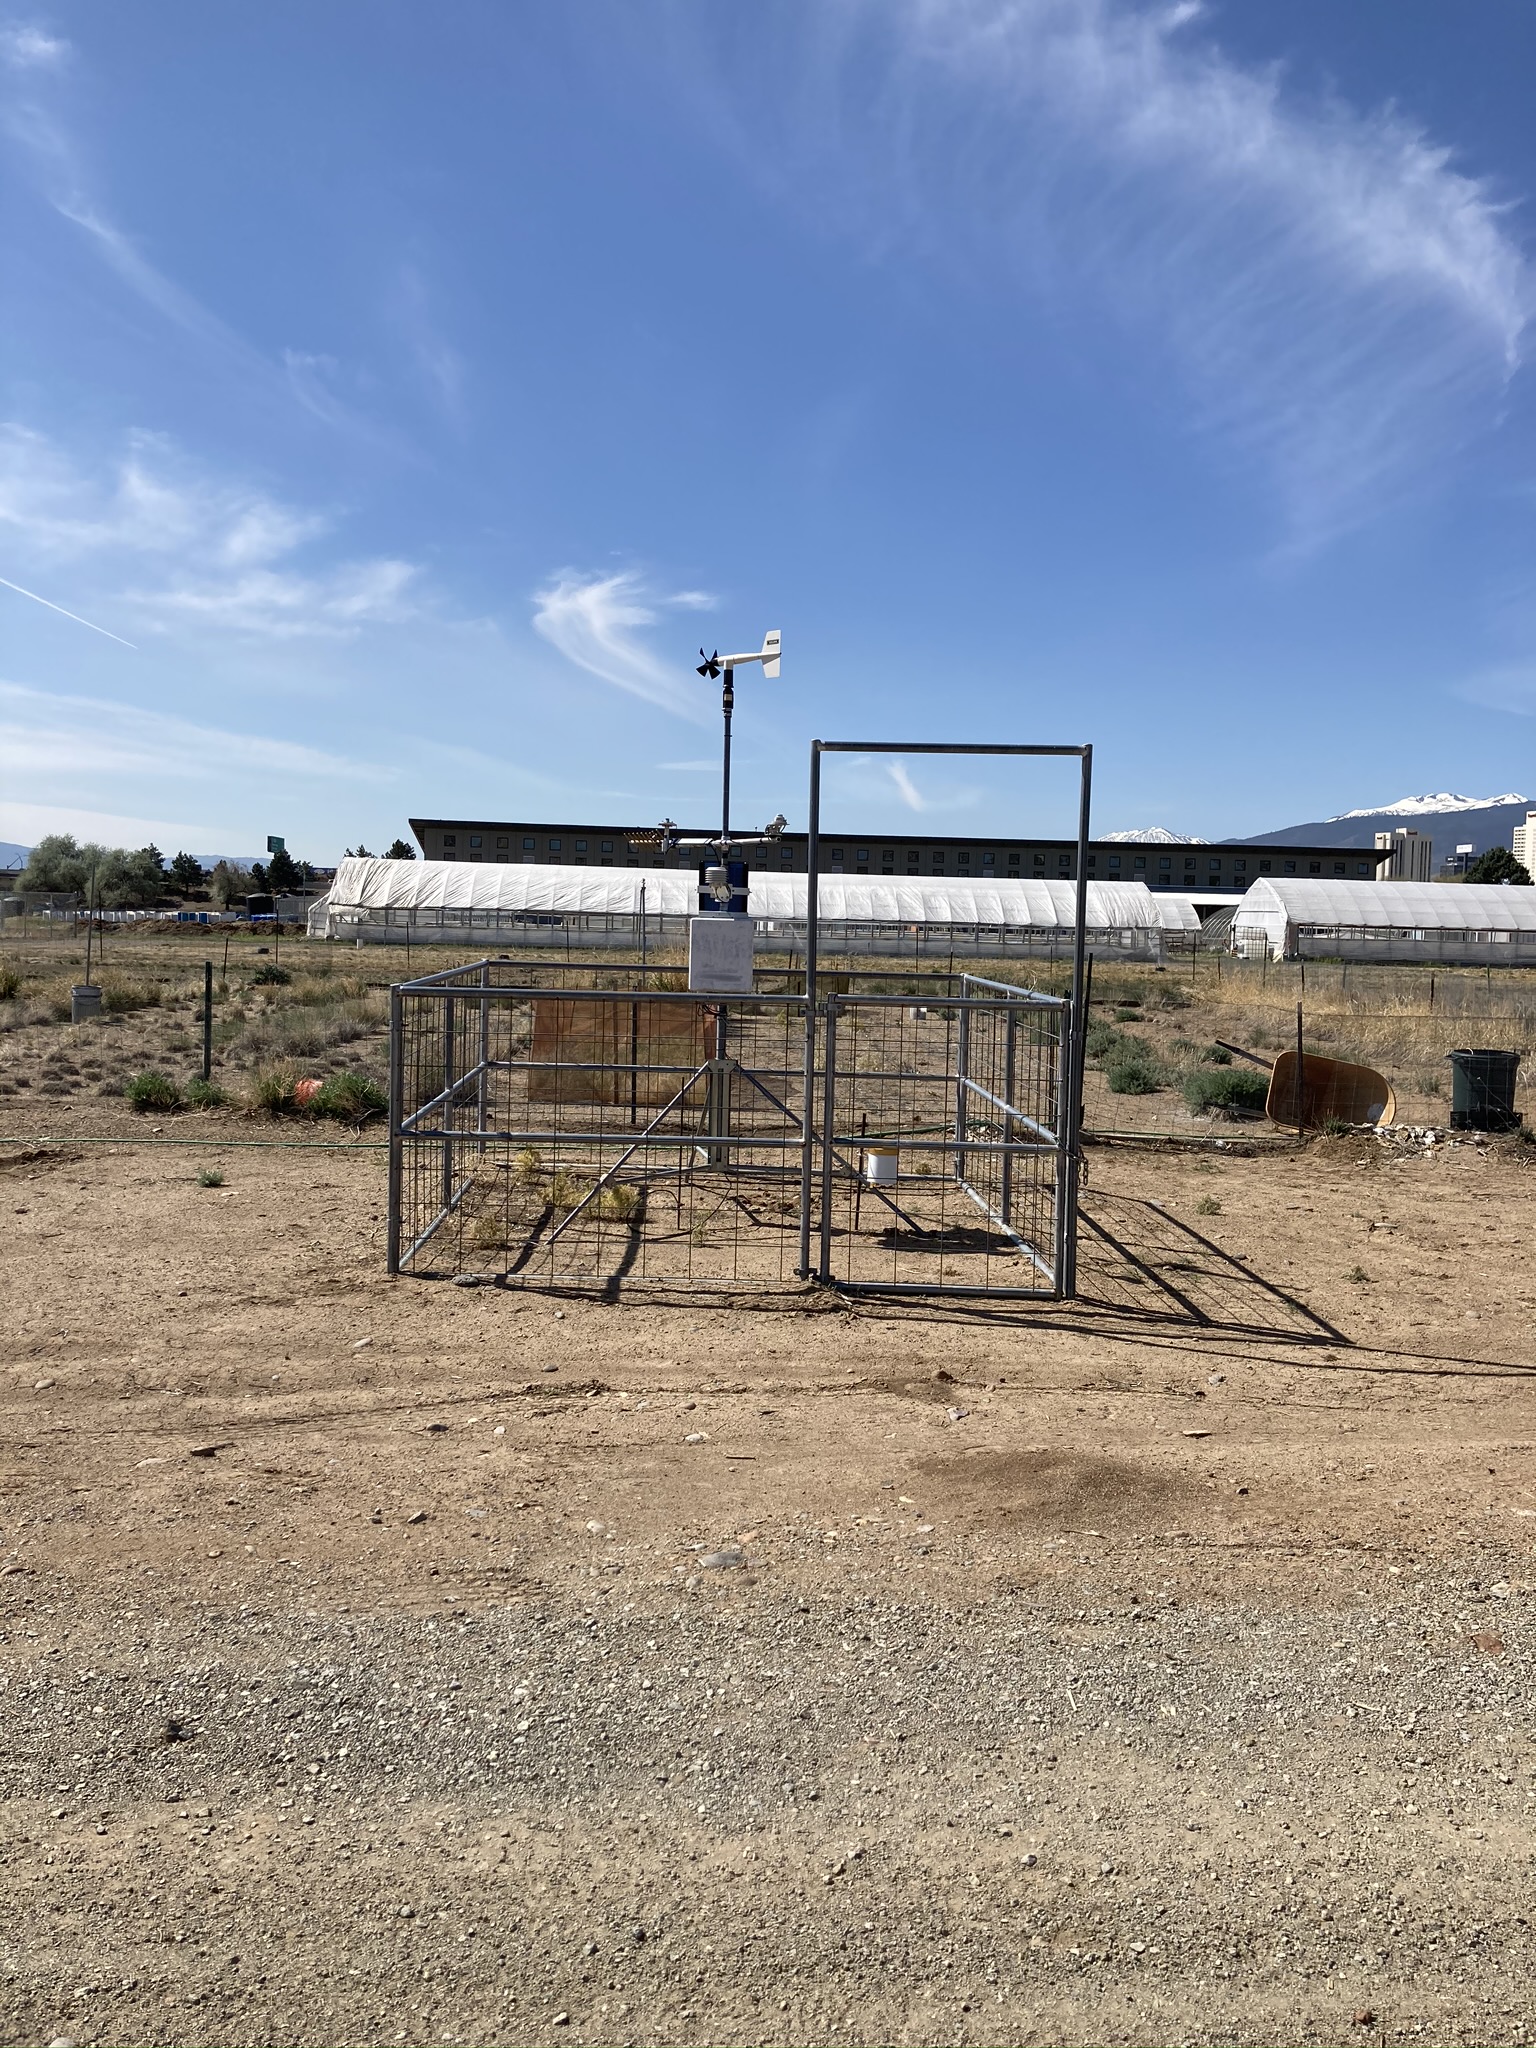
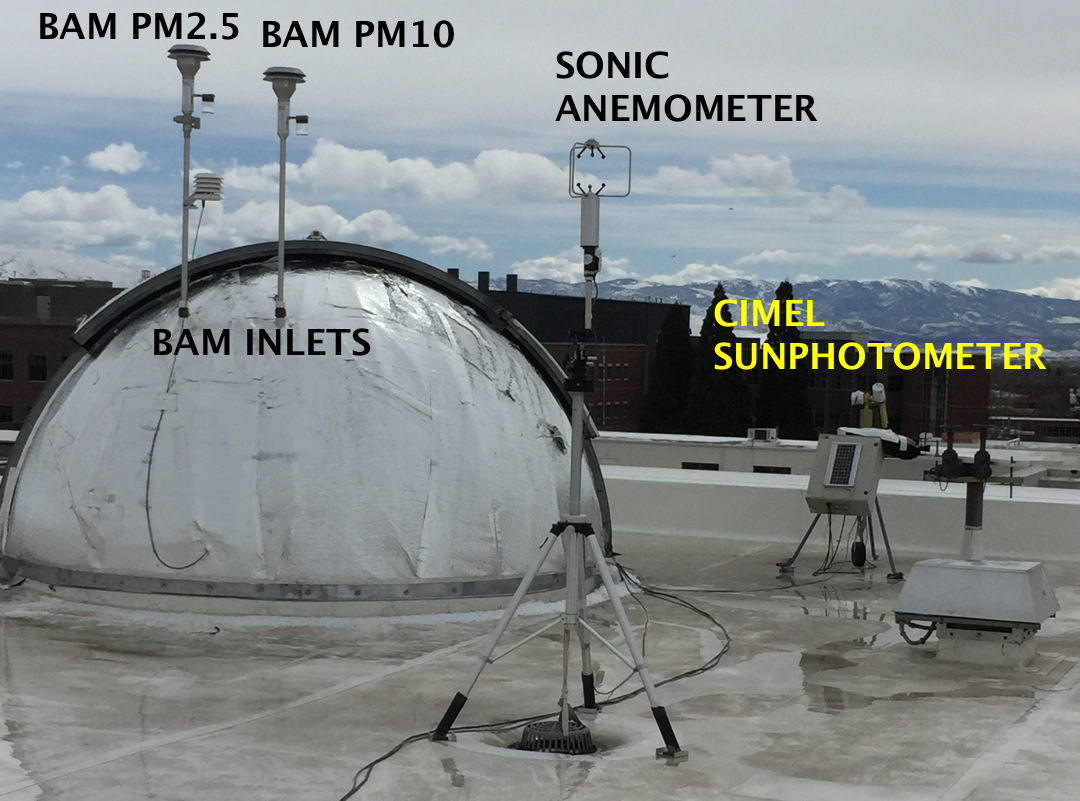 Broad view of the sonic anemometer and others. |
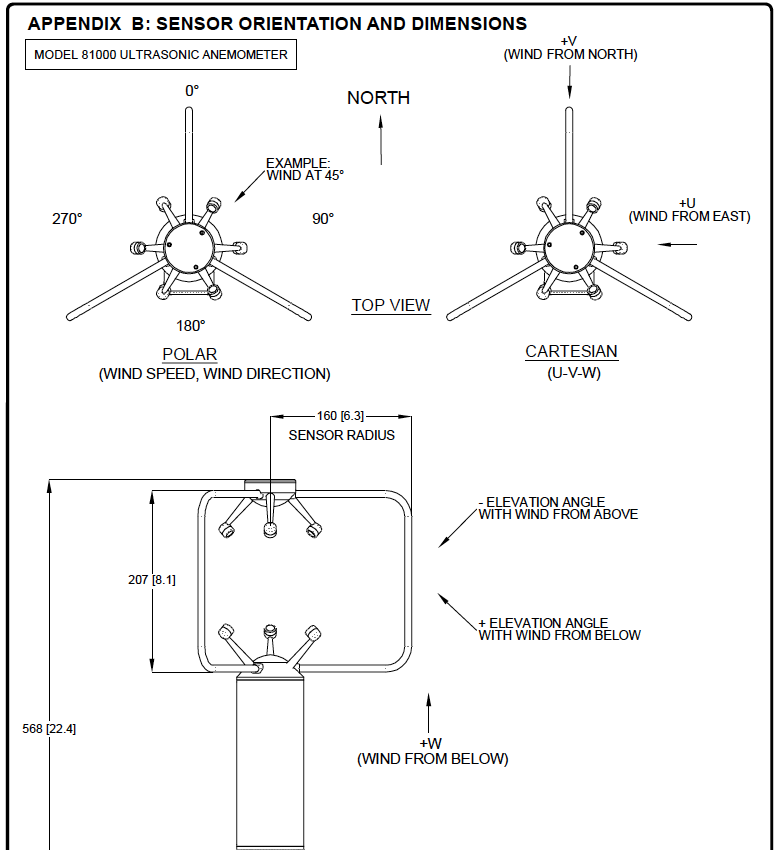
 Close up of the sonic anemometer. |
Documentation:
|
Sonic data for March 2025: |
 |
 |
 |
 |
 |
Documentation: |
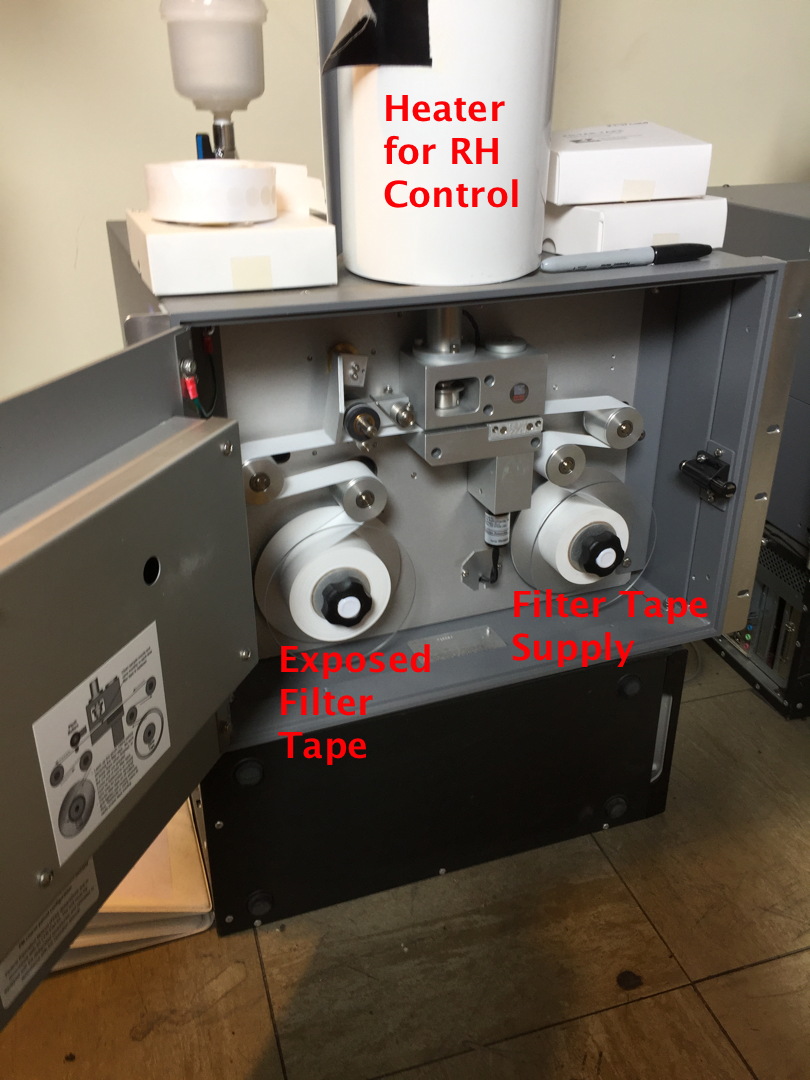
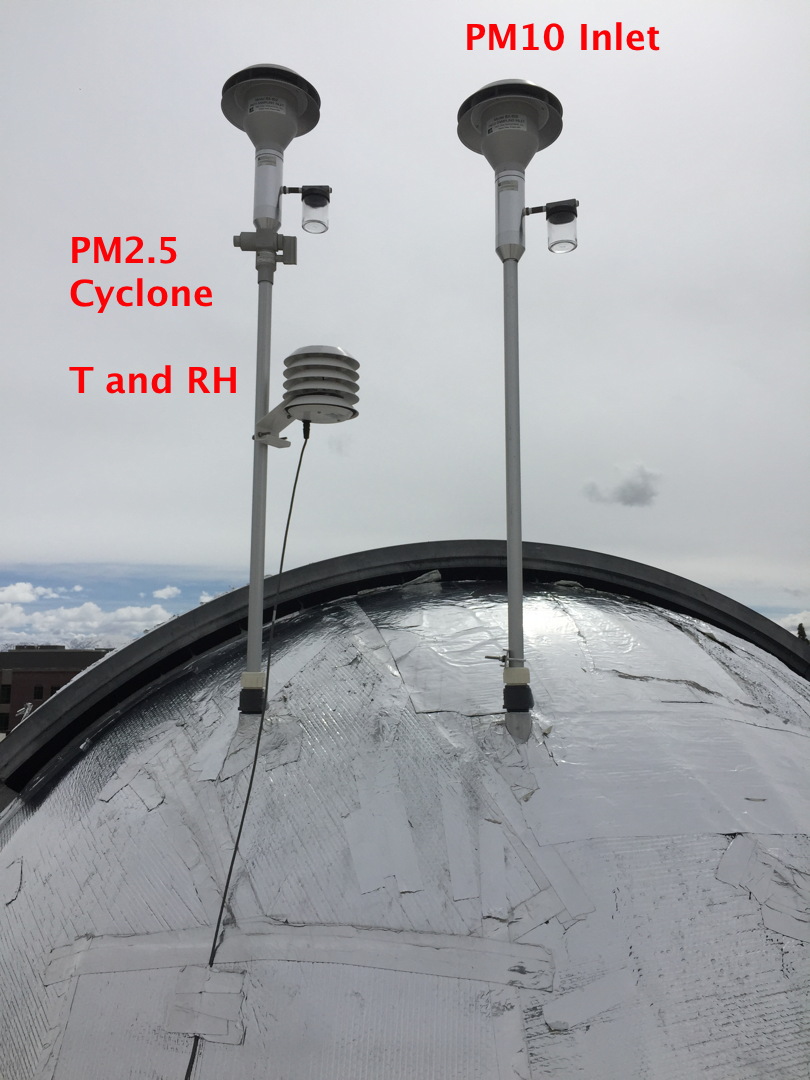 Beta Attenuation Monitor (BAM) Inlets for PM2.5 and PM10. PM2.5 has a cyclone to remove aerosol larger than 2.5 microns in diameter. (Article on cyclones). |
 How a cyclone works to take out larger aerosol by impaction and vortex flow. From this article on bioaerosol detection. |
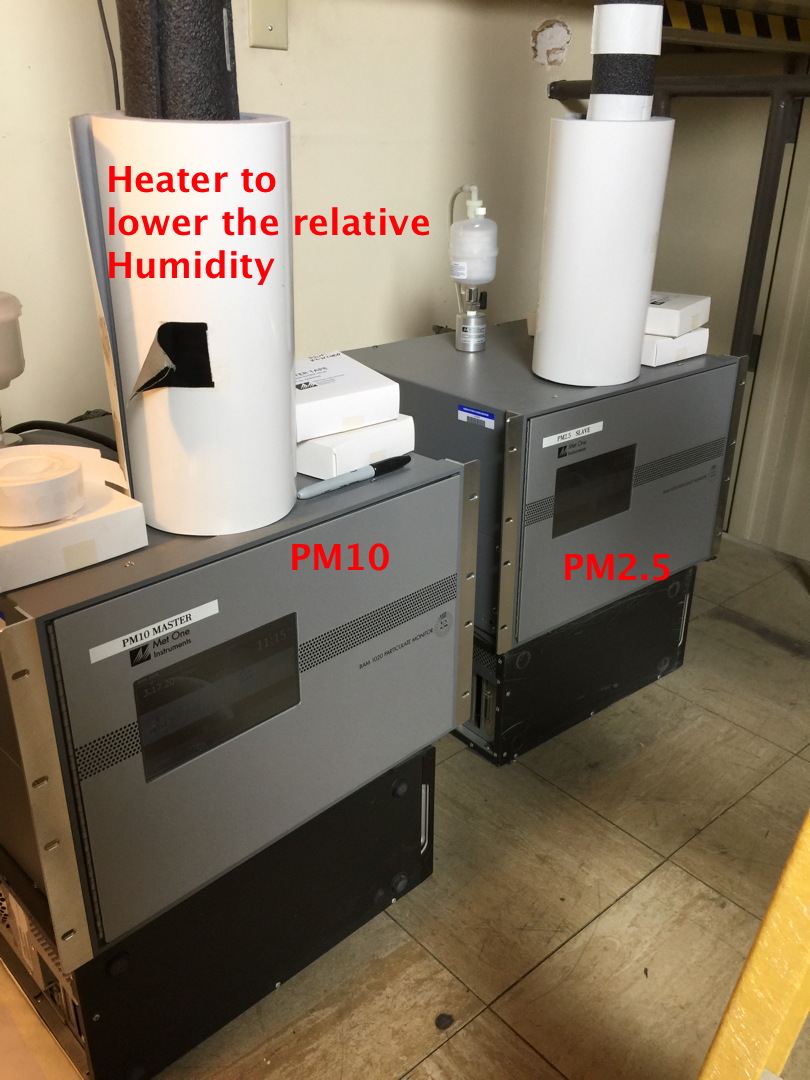 The two BAM instruments at UNR, inside the telescope dome. |
|
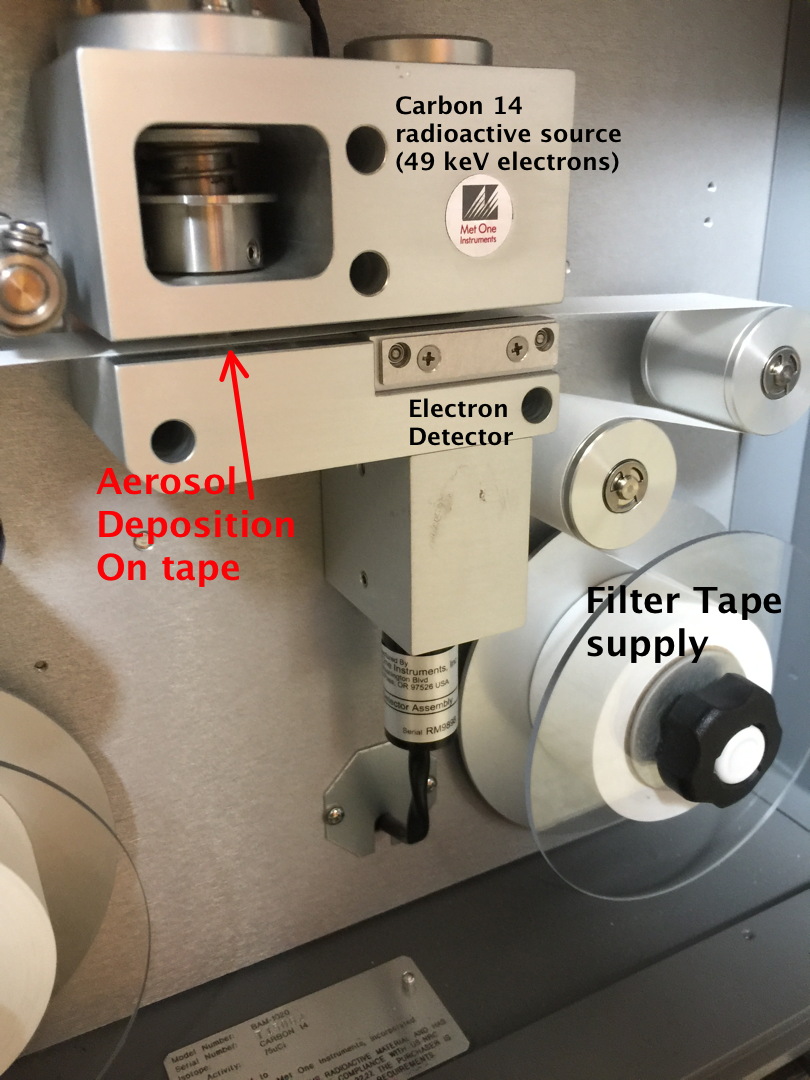 Detailed view of the radioactive C14 source for the BAM detection scheme. |
|
Documentation: Calculate the speed of 49 KV electrons from the radioactive source. |
BAM Data for January 2021: BAM Zero Filter Data for 7-12 November 2019: HOURLY MEASUREMENTS: |
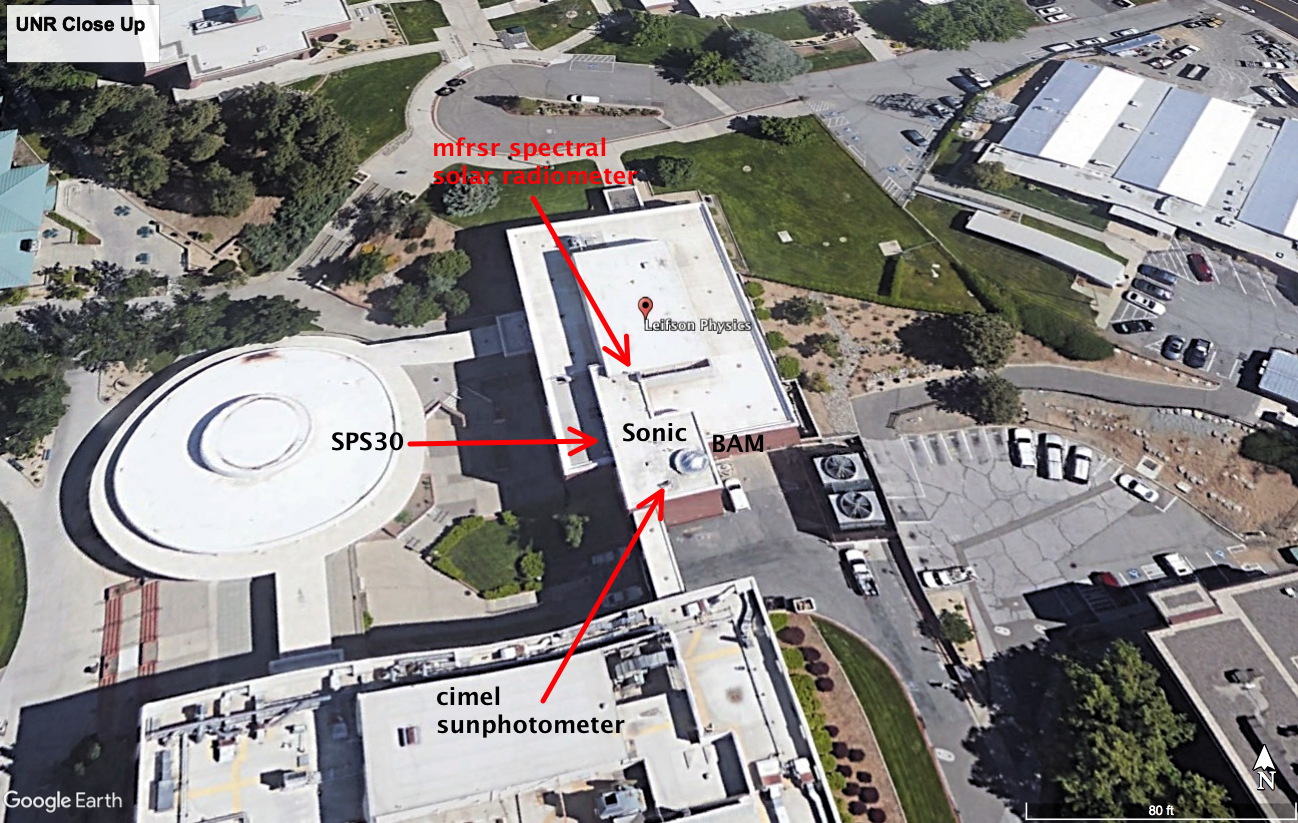
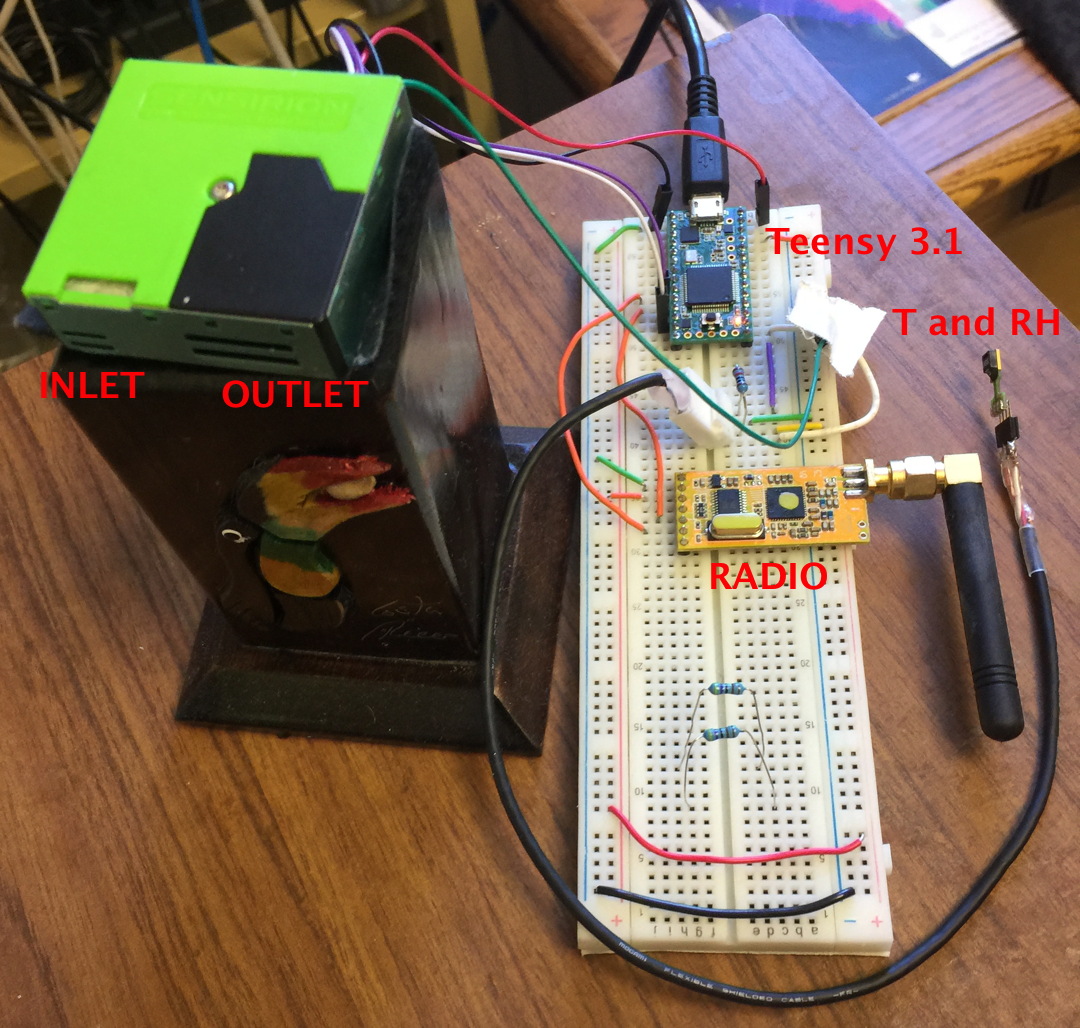
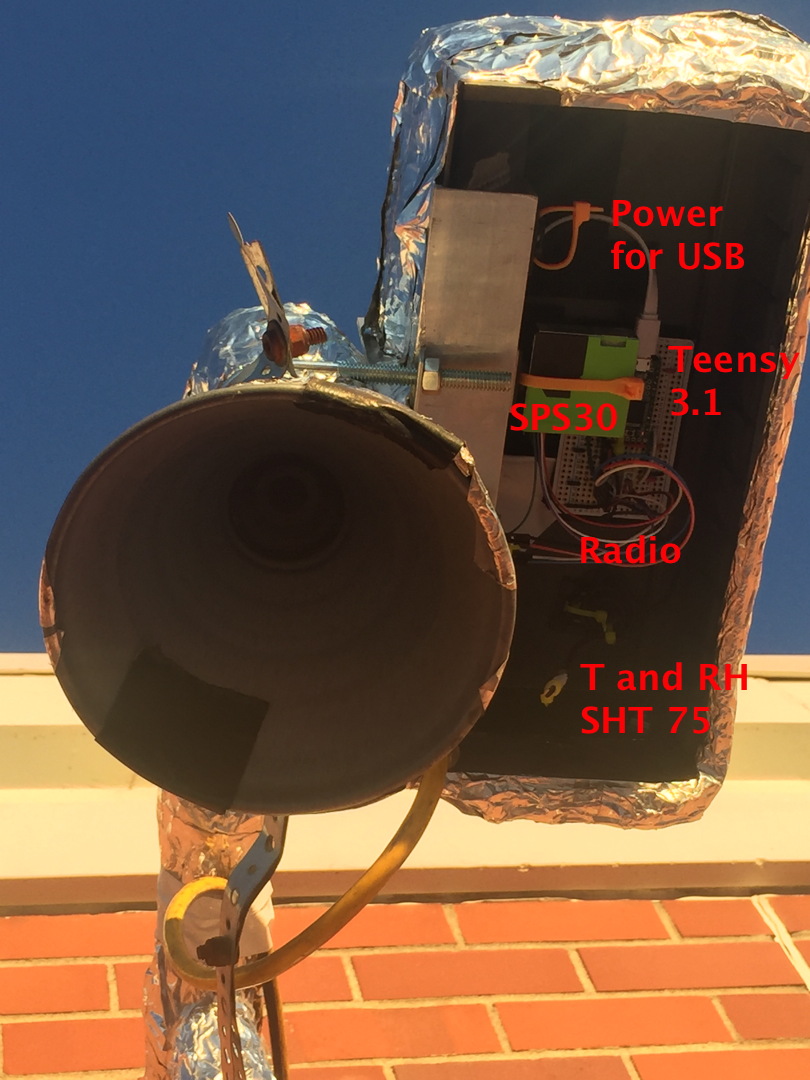 SPS 30 mounted near the photoacoustic instrument inlet on the 4th floor of Leifson Physics roof area. |
|
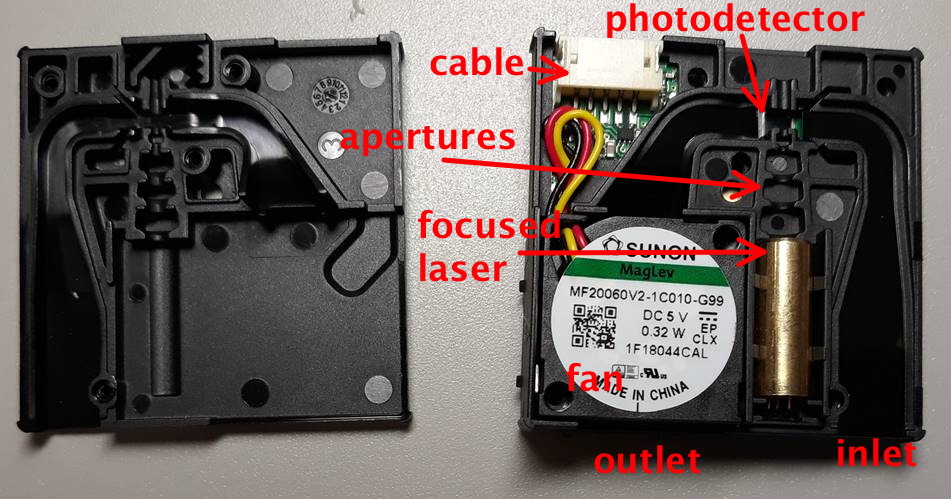 Detailed view of the interior of the SPS30 particle sensor. |
MINUTE MEASUREMENTS INCLUDE: a. Aerosol size distribution from 0.3 um to 10 um in 5 bins. b. PM1, PM2.5, PM4, and PM10. c. Ambient temperature and relative humidity. PROPERTIES CALCULATED FROM THE SIZE DISTRIBUTION MEASUREMENTS: a. PM1, PM2.5, and PM10 (to evaluate reported values). b. Aerosol light scattering coefficient, and asymmetry parameter at 19 wavelengths from the UV to the near IR assuming spherical particles, for PM1, PM2.5, and PM10 size cuts. |
Documentation: |
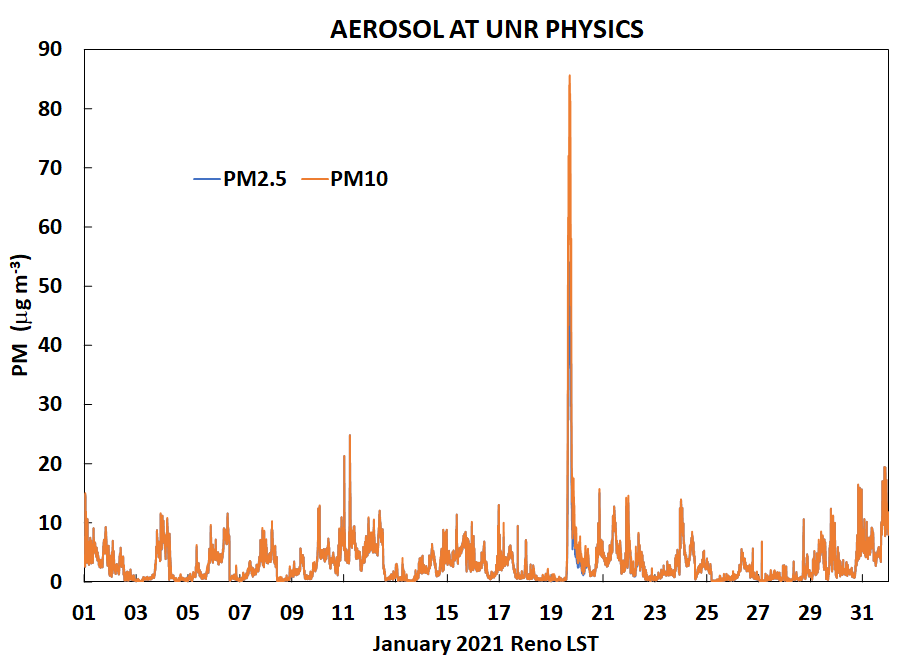
SPS30 Data for January 2021: |
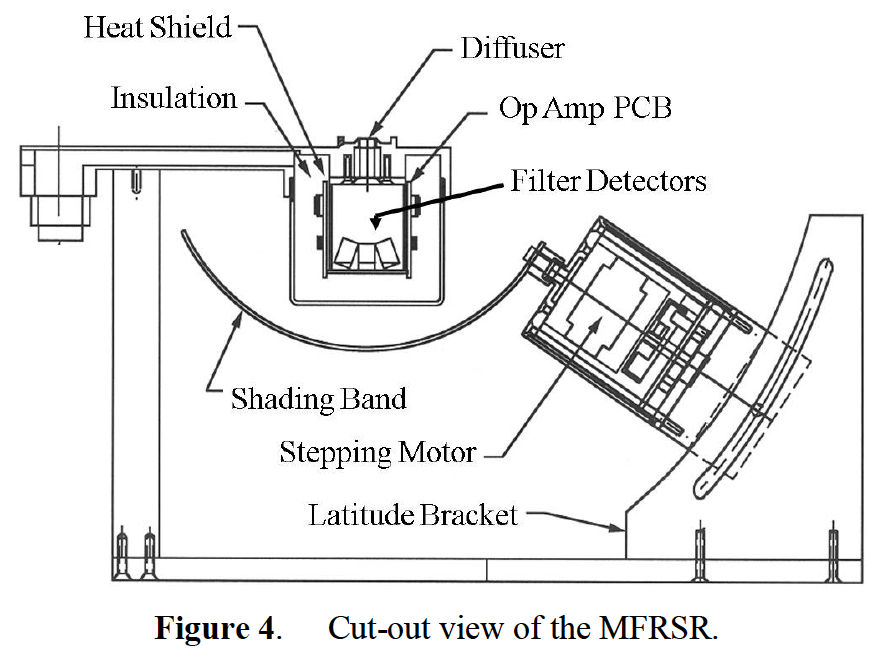 Blow up of the MFRSR, from the MFRSR Manual. |
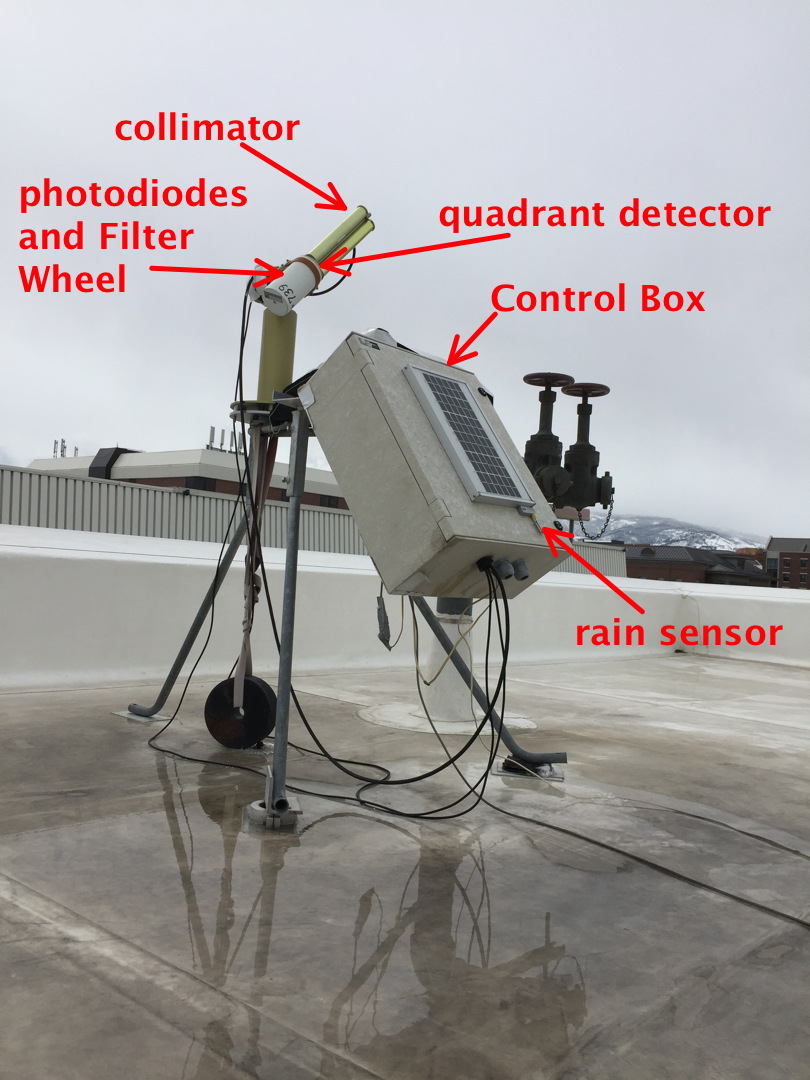
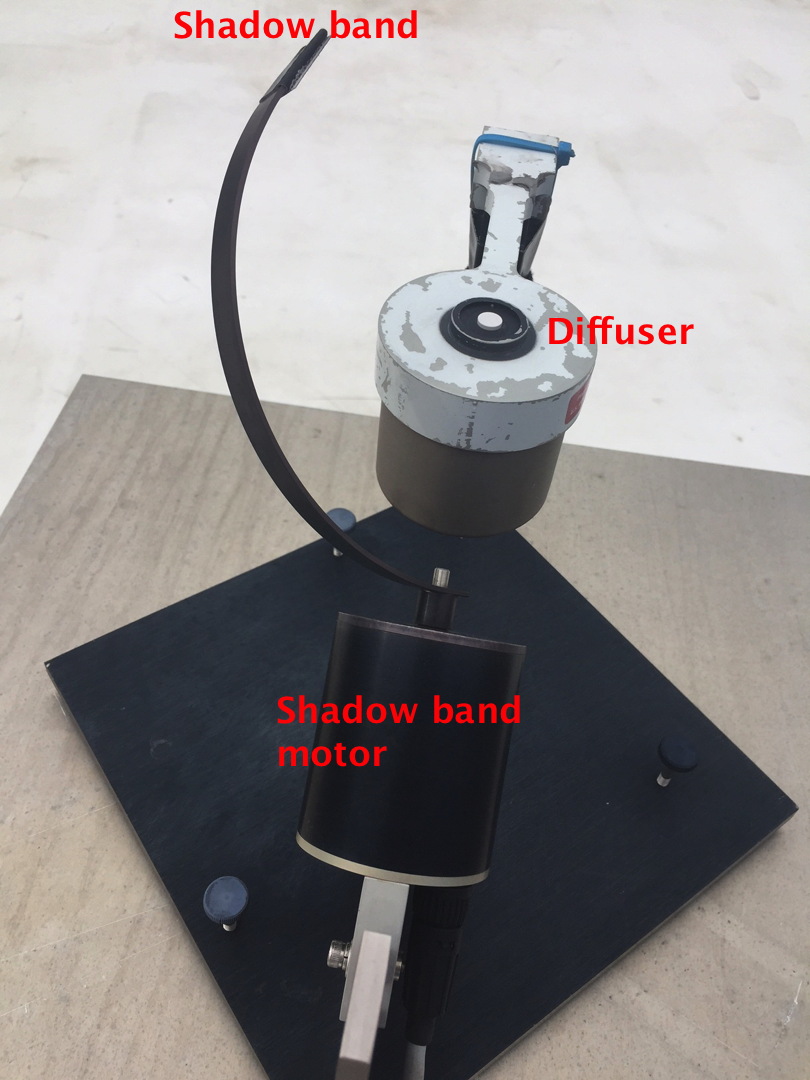 View of the MFRSR mounted on the roof of the Physics building. It is vital that the diffuser is horizontal, and that the motor points due to geographic north. |
|
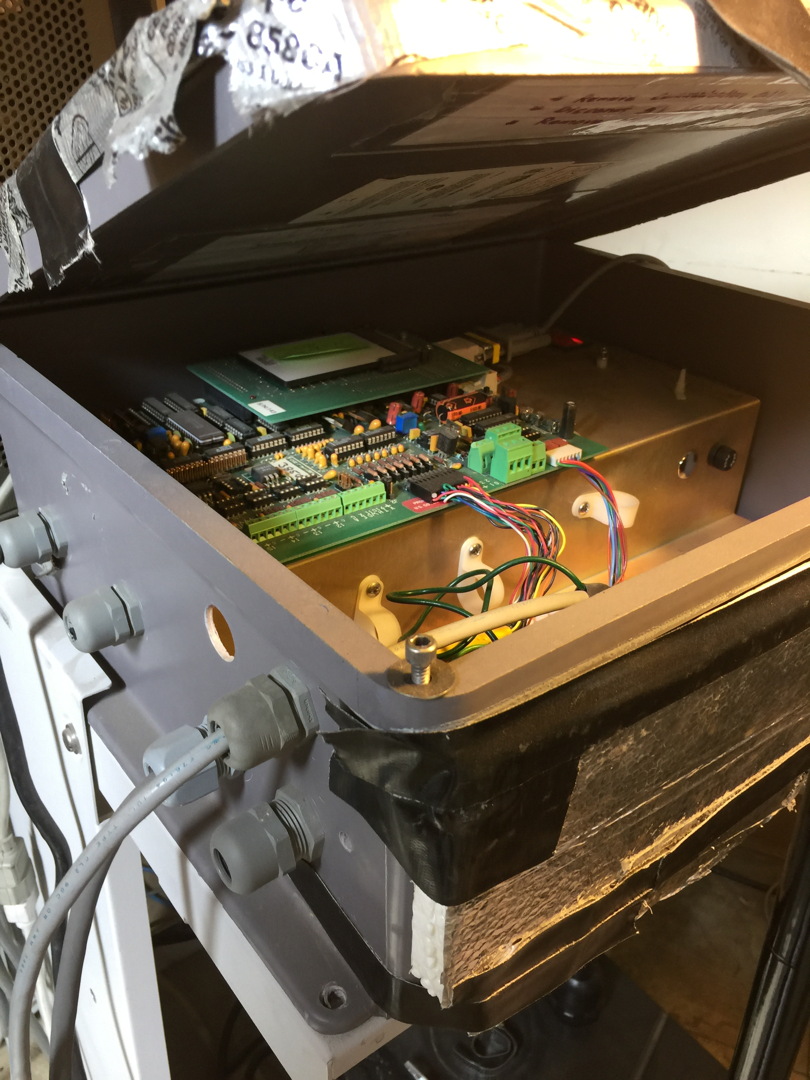 MFRSR electronics/control box. (Old school but effective.) |
| Documentation: MFRSR Handbook. Manuscript describing measurements from the MFRSR. |
MFRSR DATA FOR JANUARY 2021: |
 |
|
| Documentation: Video of the sunphotometer in operation. Sunphotometer presentation by Chris. Aeronet network description. |
Cimel Data Portal: |
|
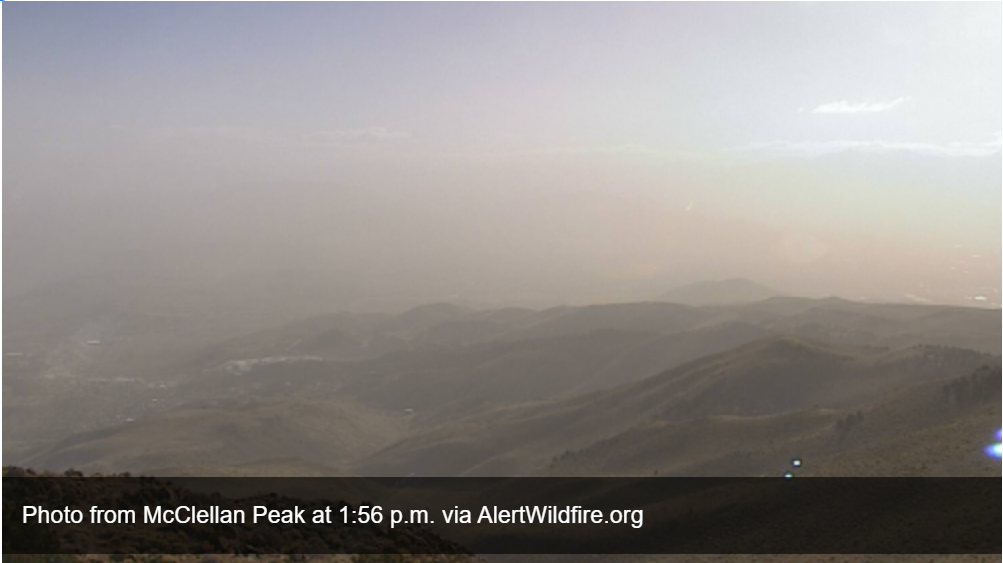
Headlines on January 19, 2021:"Dust reaching Carson City area from Black Rock Desert prompts weather service advisory"
|
| GFS model winds and sea level pressure. View various pressure levels. |
| NASA Worldview true color image from the MODIS sensor on the the AQUA satellite for 13:30 LST on January 19th, 2021. Be sure to zoom the Northwestern Nevada area to see the desert dust. Also look at the MODIS/Terra image for the cloud hole off the coast of Baja California. |
| Reno radiosonde measurement at 0Z January 20th. |
| High resolution version of the radiosonde measurement at 0Z January 20th. |
| Looking towards Reno from the East North East Google Earth online. |
Summary of Resources and References:
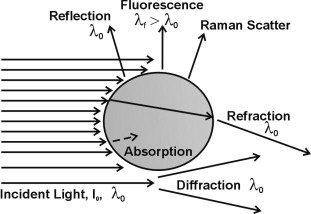
In situ light scattering and absorption theory and measurements: (Not used in this study, but educational).
Light scattering by wind blown dust.
Photoacoustic instrument manual for aerosol light scattering and absorption measurements.
Photoacoustic optical properties at UV, VIS, and near IR wavelengths for laboratory generated and winter time ambient urban aerosols.
Sonic Anemometer:
Sonic anemometer manual.
Presentations on sonic theory and student projects. Presentation 1, Presention 2, Presentations 3.
Gill manufacturer of sonic anemometers.
RM Young manufacturer of sonic anemometers.
Beta Attenuation Monitor (BAM1020):
BAM1020 Manual.
How a cyclone works to take out larger aerosol by impaction and vortex flow. From this article on bioaerosol detection.
Calculate the speed of 49 KV electrons from the radioactive source.
About radioactive decay.
Carbon 14 discussion.
SPS30 Low Cost Air Quality Sensor:
Data sheet describing the SPS30
How to install the SPS30
Article on performance of low cost air quality sensors, including the SPS30.
Our website with SPS30 software
Article discussing 'machine learning' to improve the response to PM Coarse aerosol.
Related Sensor Network Based On The PMS5003, a Similar Sensor to the SPS30.
New and Important: SPS30 Application note and description of measurement method.
MFRSR Remote Sensing Instrument
MFRSR handbook.
Manuscript on MFRSR measurements.
Sunphotometer theory for remotely sensing column aerosol optical depth.
Sun photometer theory.
Our sunphotometer analysis website (air mass and Rayleigh optical depth calculator based on Perl language, here's the source code).
Articles describing aerosol and health.
Dissertation (see Figure 6).
Journal article (see Figure 2).
EPA Criteria Pollutants.
Criteria Air Pollutants and National Air Quality Standards.
Hysplit Air Trajectory Analysis.
Hysplit air trajectory model presentation.
Run the HYSPLIT model.
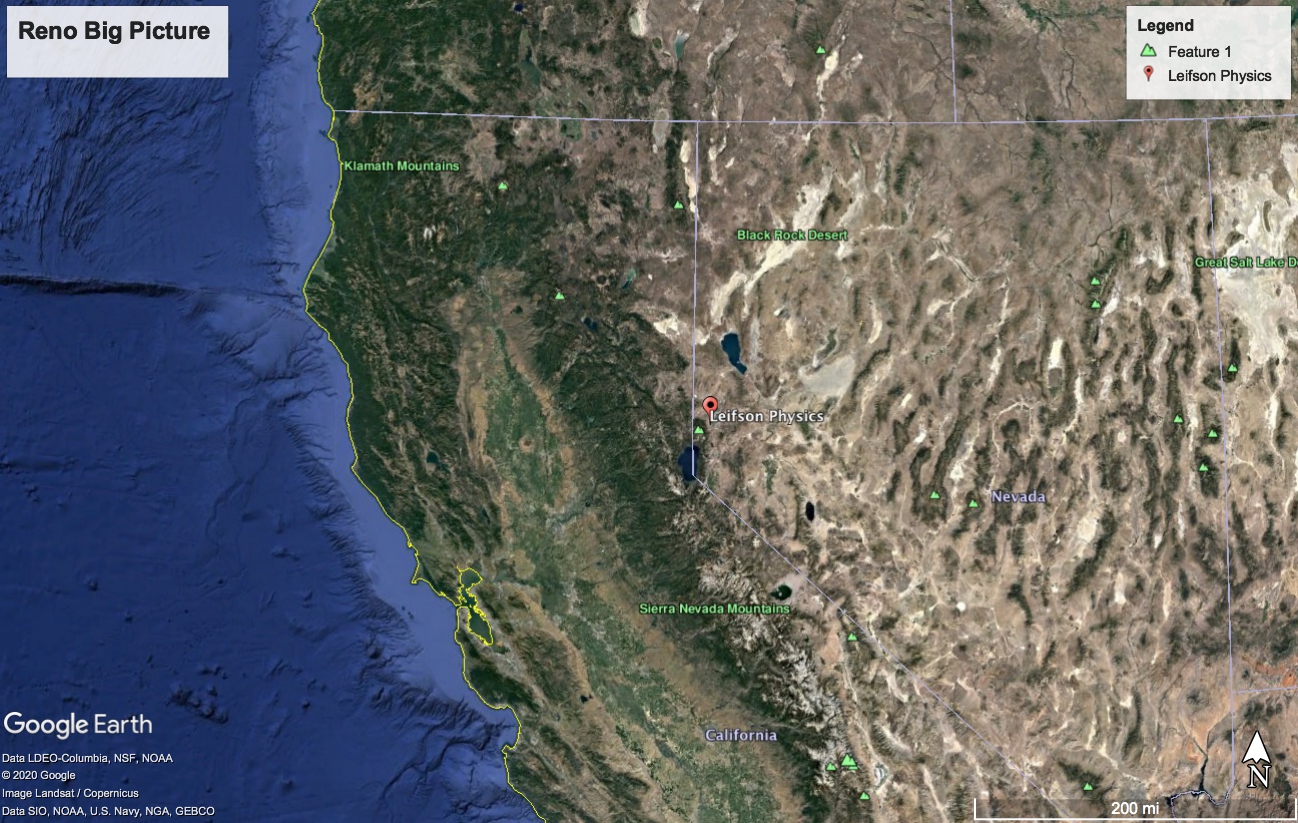
The Physics building coordinates are Latitude= 39.540980° Longitude=-119.814090° .
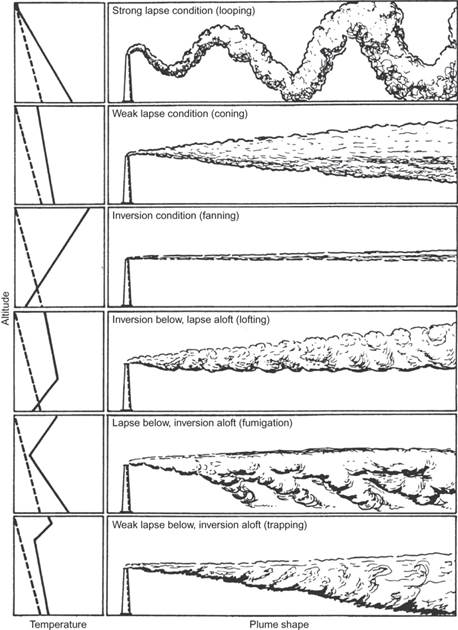
Meteorology of smoke plumes.
Lapse rate influence on smoke plume dispersion.
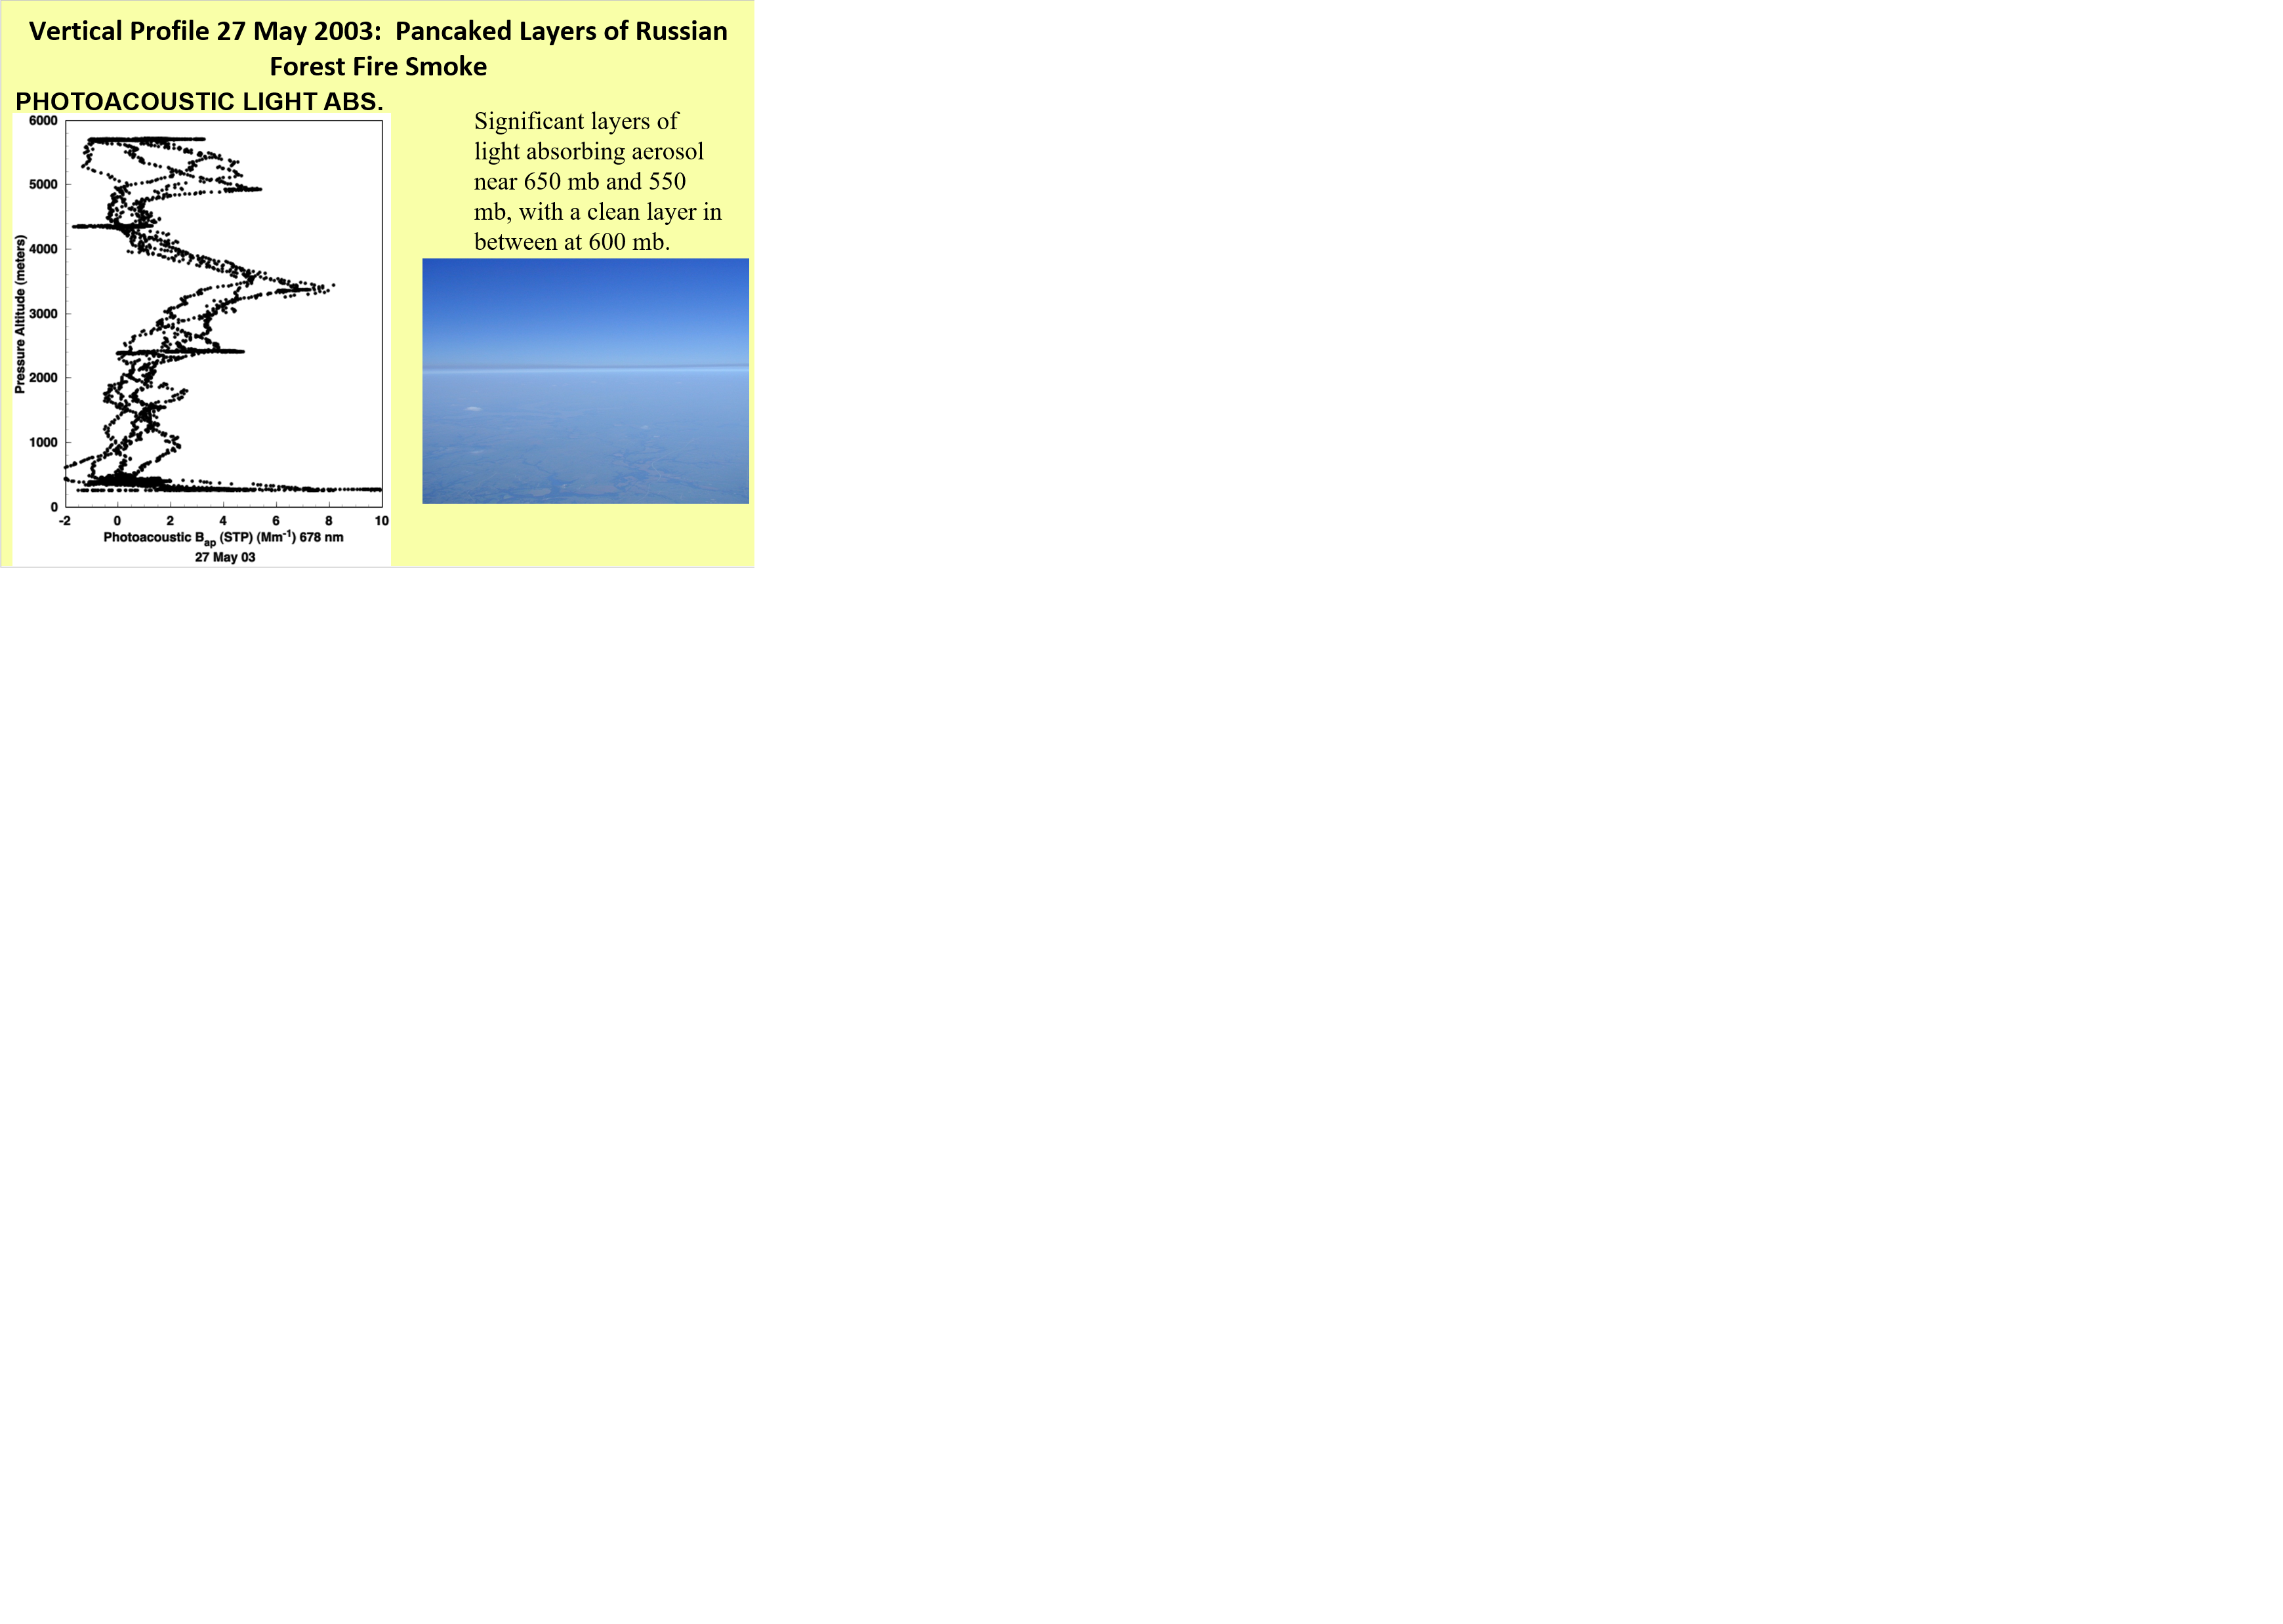
Example of smoky layer transporting across the Pacific Ocean to the US from fires in Russia.
Related References:
Satellite Remote Sensing of Particulate Pollution from Space: Have We Reached the Promised Land?
Combine the ideas of the next two papers
to estimate potential hygroscopic growth of aerosol based on RH and aerosol chemistry.
Accuracy of near surface aerosol extinction determined from columnar aerosol optical depth measurements in Reno, NV, USA, especially Fig 4.
Revised Algorithm for Estimating Light Extinction from IMPROVE Particle Speciation Data
Photoacoustic analysis of combustion aerosol presentation, including a world tour.
Air pollution and meteorology in Russia: similar to our case study.
Mexico City aerosol 2009 paper.
Mexico City and Queretaro 2019 paper.
Per capita air pollution paper.
Reno winter time air pollution paper.
Northeast Colorado air pollution paper with meteorological impacts on PM2.5 and PMCoarse concentrations.
Hysplit air trajectory model.
Applications of air trajectory analysis review article.
Infrared radiation model for clear skies, and calculation of cloud effect.
Beijing fine and coarse mode aerosol composition measurements.
EPA Criteria Air Pollutants and National Air Quality Standards.
Related Sensor Network Based On The PMS5003, a Similar Sensor to the SPS30:
 SPS 30 sensor in my office used for indoor air quality measurements.
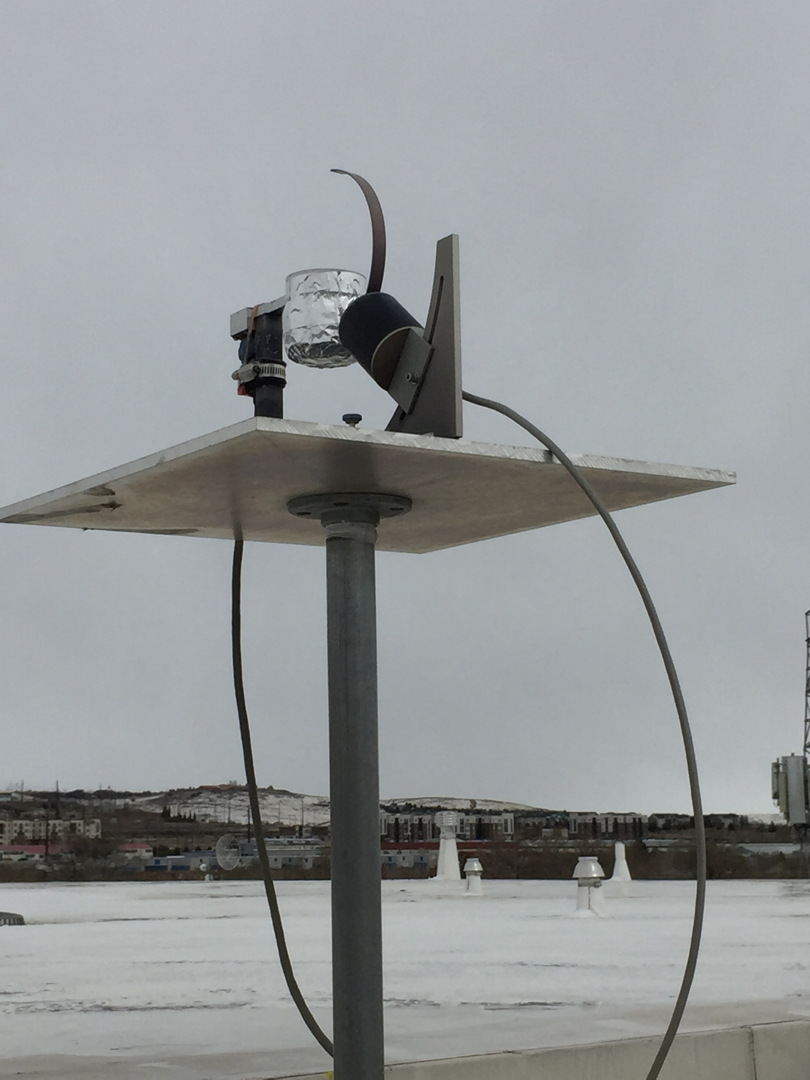