Week 15: May 6 2024
Monday: Continue with assignment 11 lee wave cloud study using radiosonde and satellite data.
Note: Meteorological model output may help understand the weather conditions for the day and time leading up to the wave cloud you're working with. We will discuss this on Monday.
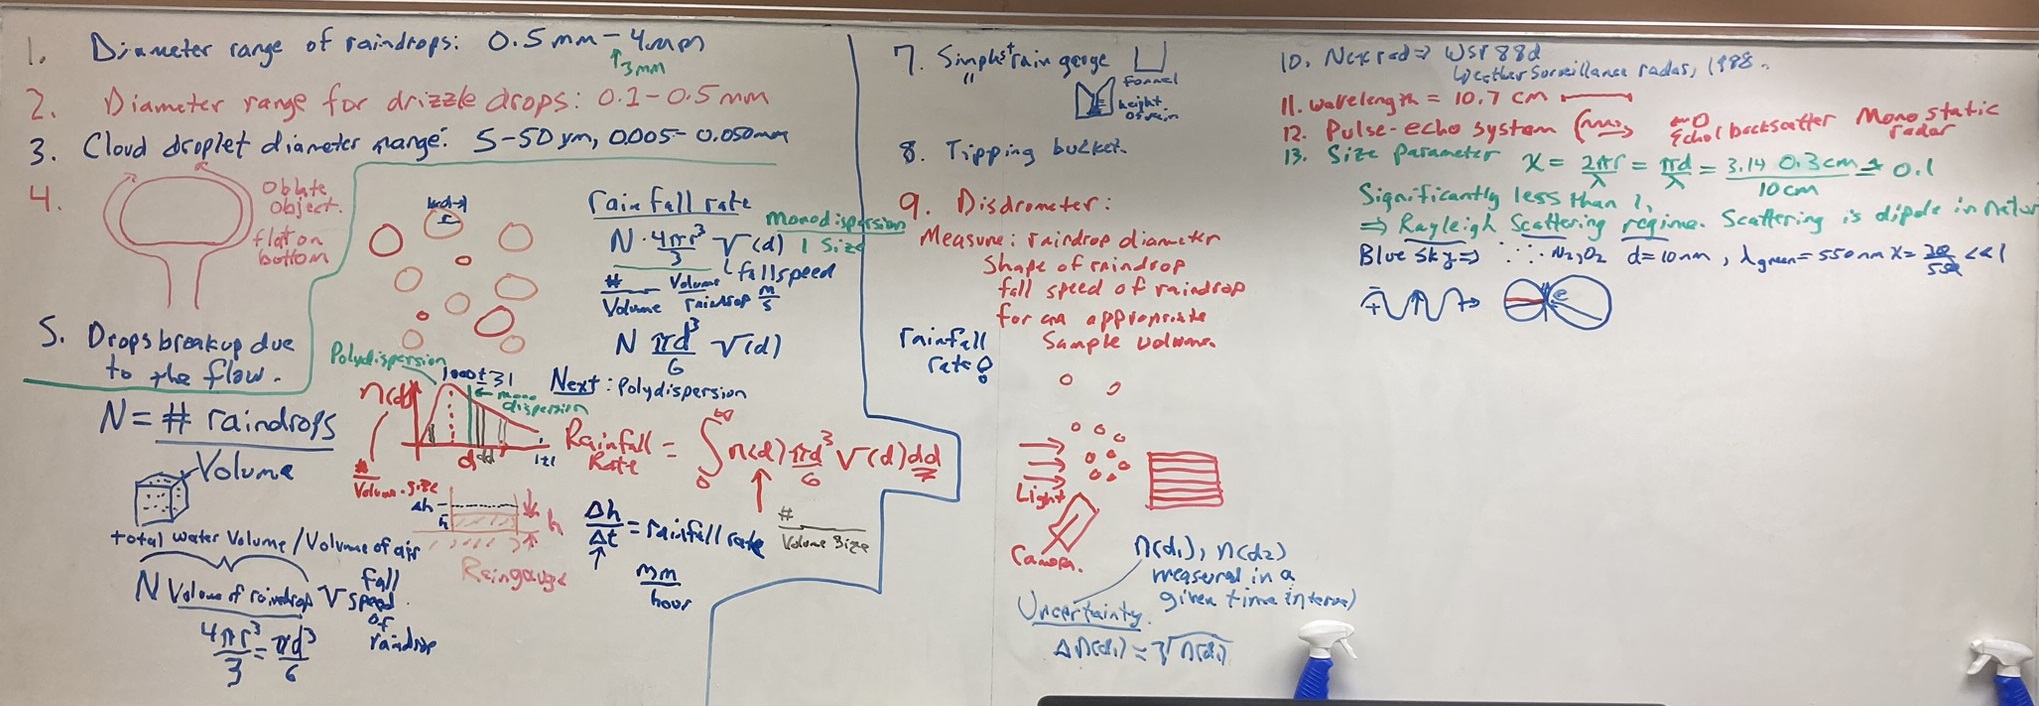
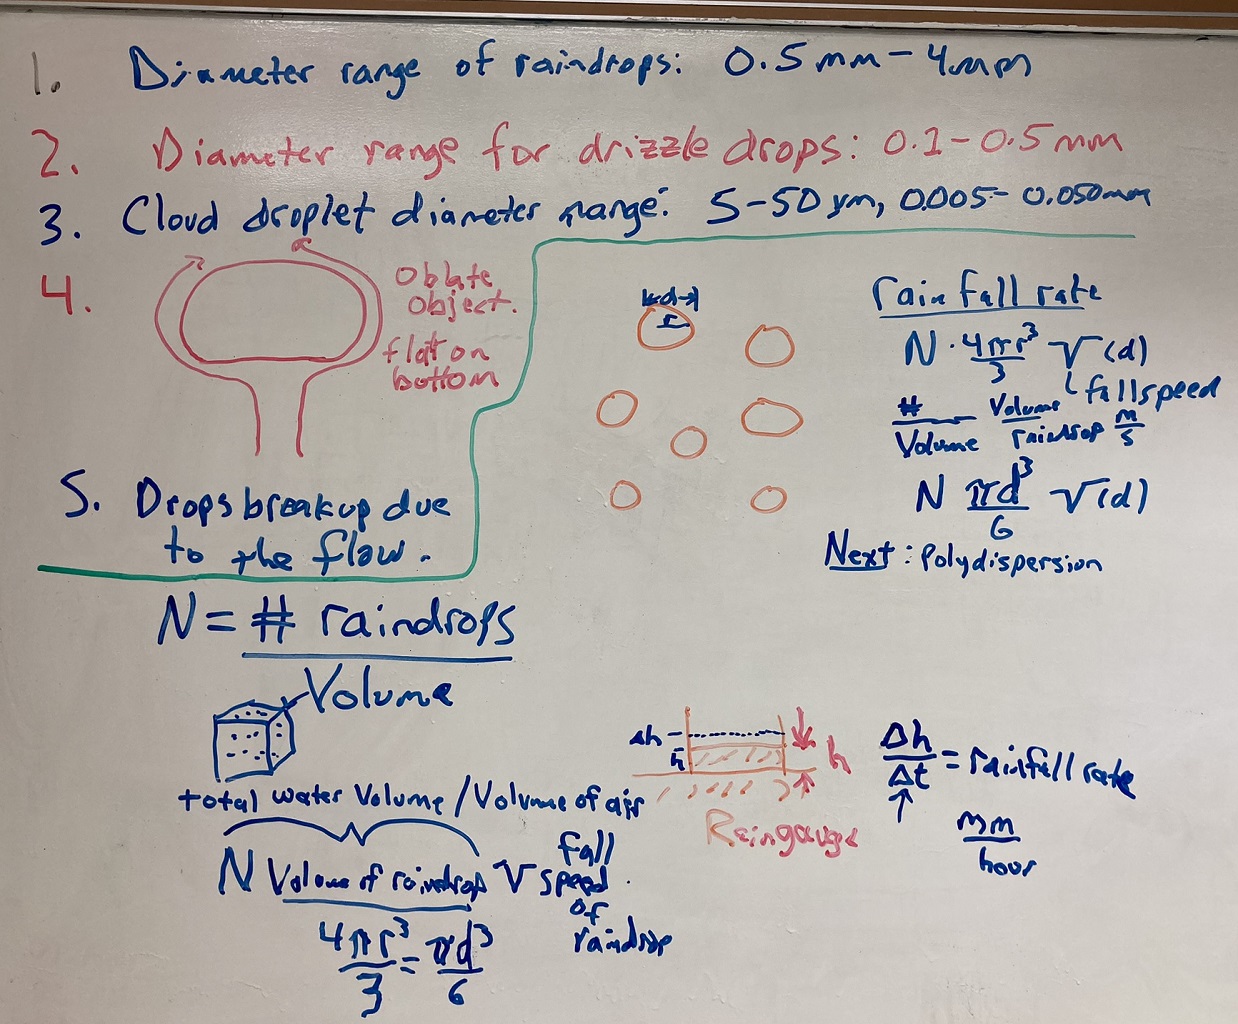
Whiteboard notes of lee wave study.
Week 14: April 29 2024
Wednesday: Finish Assignment 10: Start Assignment 11.
Monday: Assignment 10 IR sensor.
Compiled Labview program for Assignment 9 in case your computer doesn't have Labview on it.
Download the zip file and extract it before running it.
Compiled Labview program for Assignment 10 to try if you don't have the Labview development environment on your computer.
Download the zip file and extract it before running it.
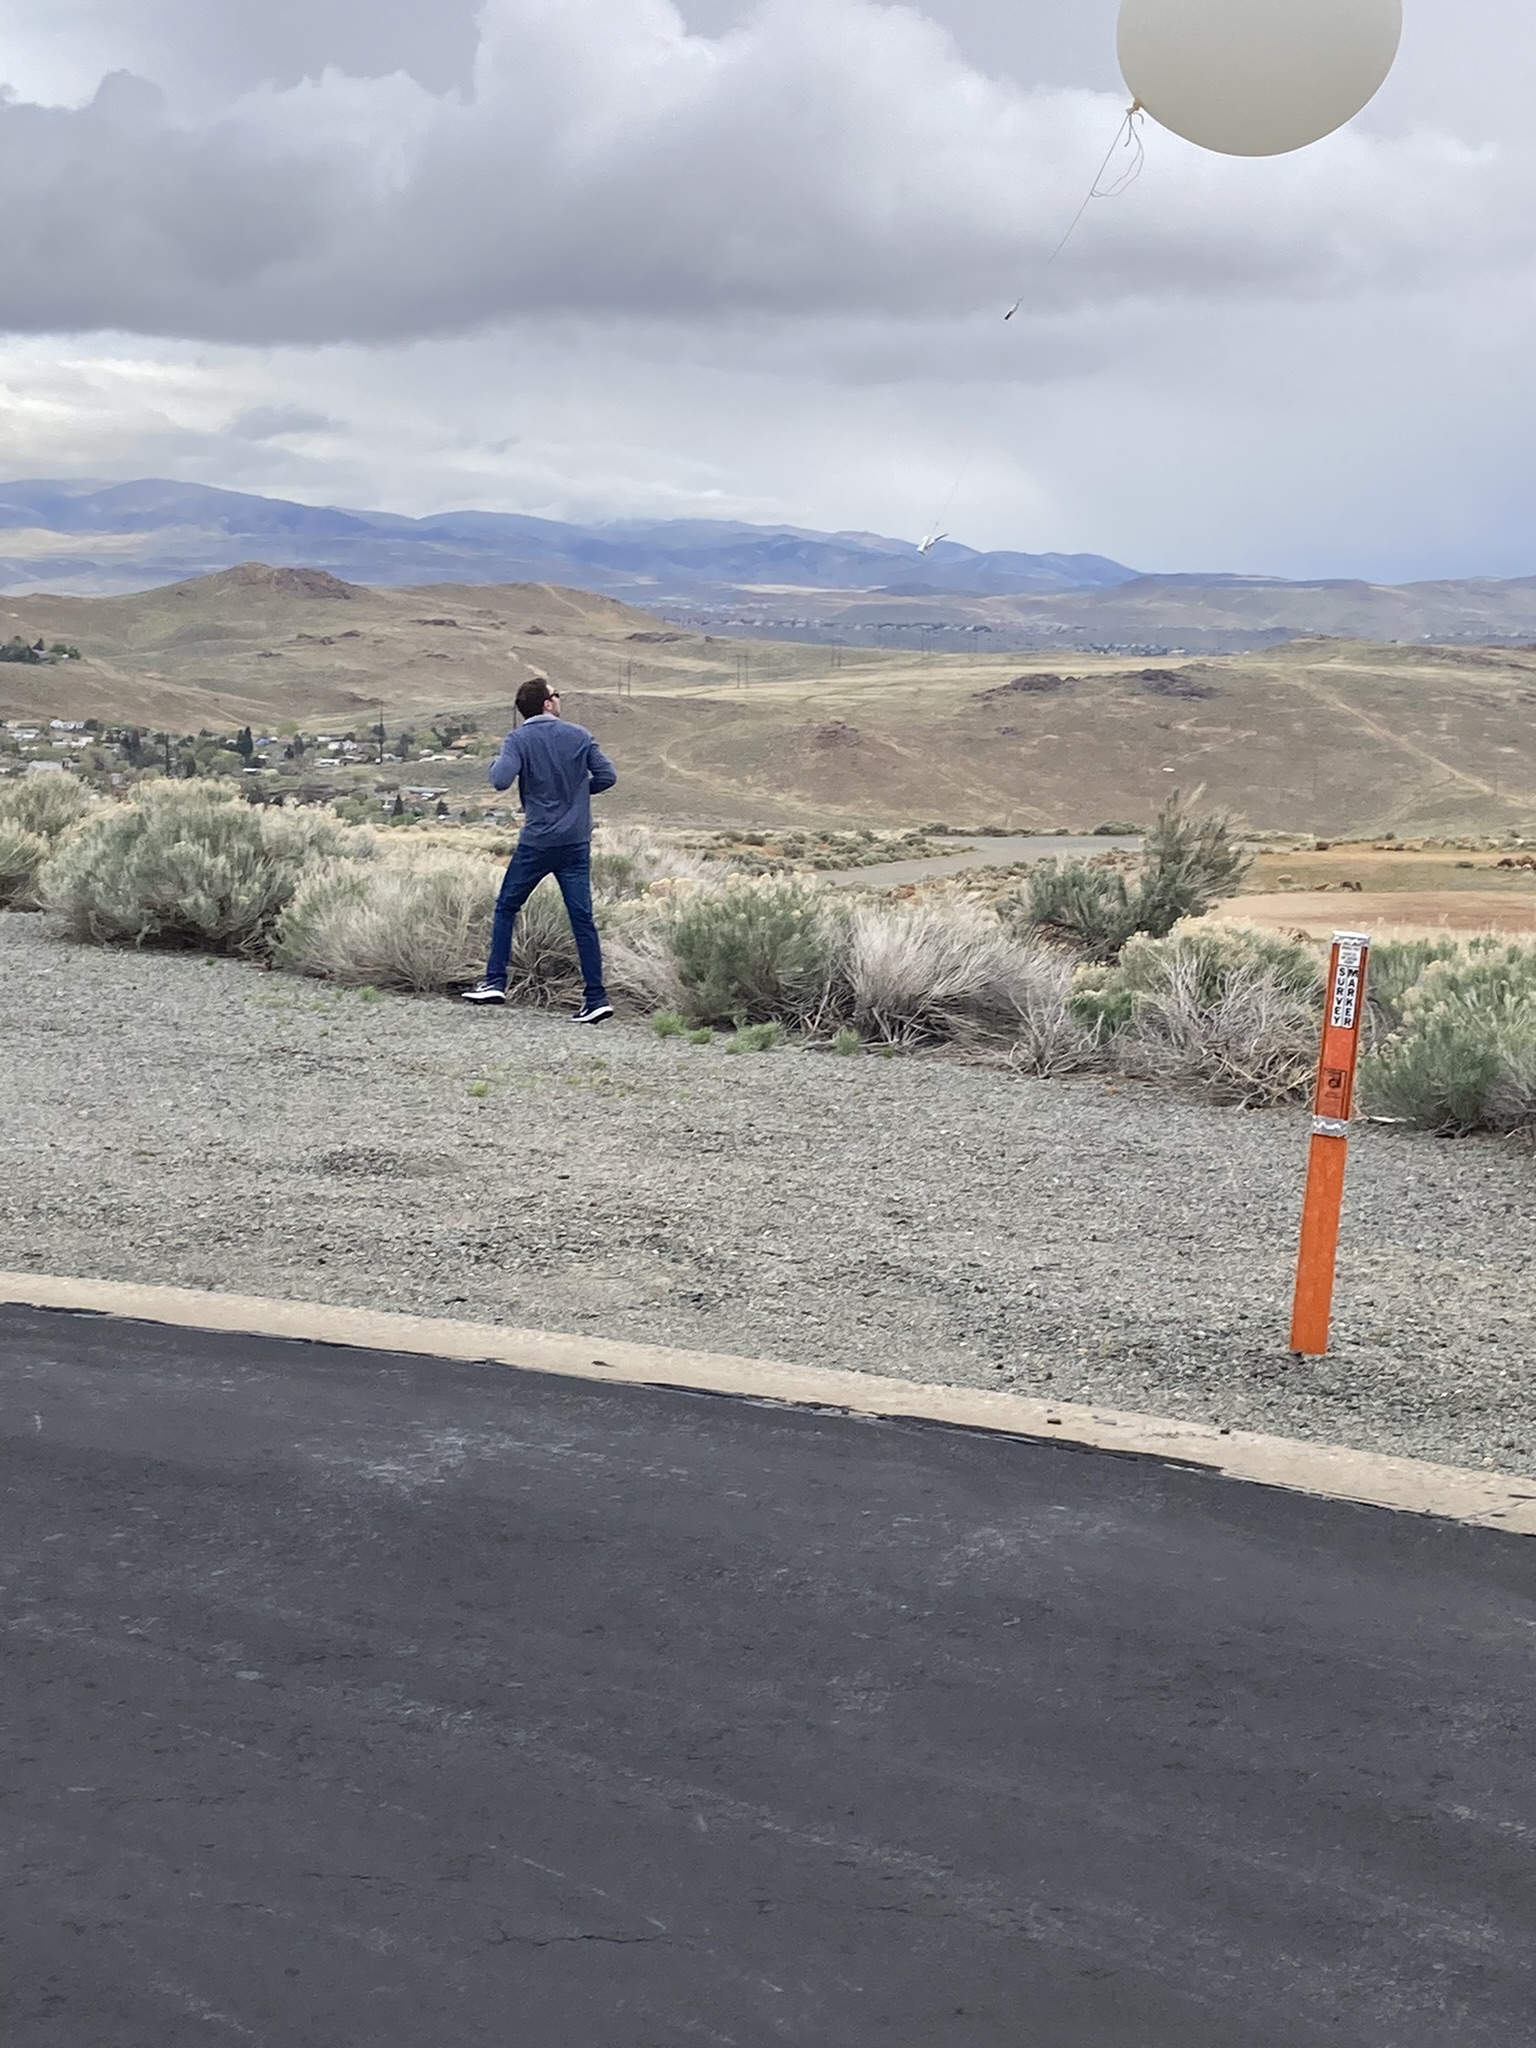
Weather balloon launch from last Friday.
Week 13: April 22 2024
Wednesday and/or Friday:
Discuss significant digits, uncertainty, accuracy and precision (see Week 12).
Show the Labview VI programming style by looking at the block diagram and turning on the light bulb to watch it work.
We will continue with assignment 9, pressure sensors.
The Labview VI was revised to allowing setting the baudrate from the front panel.
Be sure to unzip it before running the VI.
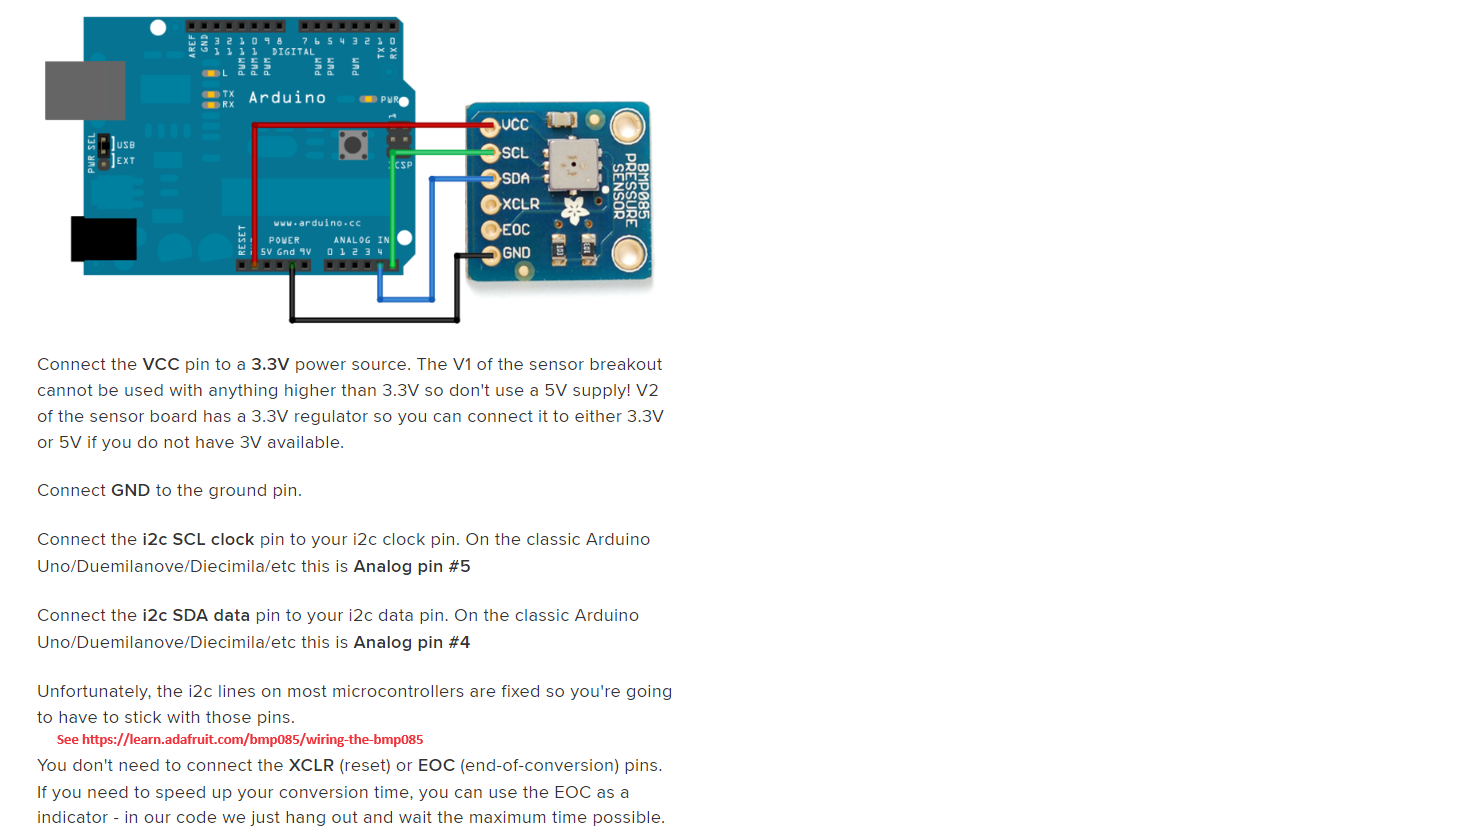
BMP280 wire diagram. Note that Arduino 5 V pin is connected to the BME280 Vin terminal.
Arduino pin 4 = SDA, Arduino pin 5 = SCL. BME280 SCK=SCL SDI=SDA.
Analog pressure sensor wiring schematic.
Wiring schematic for both sensors together.
Discuss:
Motivation for this lab.
Example of radiosonde measurements.
Range of pressure measurements needed in the atmosphere.
Week 12: April 15 2024
We will continue with assignment 9, pressure sensors.
BMP280 wire diagram. Note that Arduino 5 V pin is connected to the BME280 Vin terminal.
Arduino pin 4 = SDA, Arduino pin 5 = SCL. BME280 SCK=SCL SDI=SDA.
Analog pressure sensor wiring schematic.
Wiring schematic for both sensors together.
Discuss:
Motivation for this lab.
Example of radiosonde measurements.
Range of pressure measurements needed in the atmosphere.
Measurement uncertainty presentation, and description.
Significant digits and implied uncertainty examples:
τ=0.00543789 seconds has 6 significant digits and an implied uncertainty of ± 0.00000001 seconds; Too many significant digits.
Better as τ=0.005 seconds with 1 significant digits and an implied undertainty of ± 0.001 seconds; Maybe too few significant digits.
Maybe best as τ=0.0054 seconds with 2 significant digits and an implied uncertainty of ± 0.0001 seconds.
5 is the most significant digit, 9 is the least significant digit.
τ=543.789 seconds has 6 significant digits and an implied uncertainty of ± 0.001 seconds; Too many significant digits.
Better as τ=500 seconds with 1 significant digits and an implied undertainty of ± 100 seconds; Maybe too few significant digits.
Maybe best as τ=540 seconds with 2 significant digits and an implied uncertainty of ± 10 seconds.
τ=543.780 seconds has 6 significant digits and an implied uncertainty of ± 0.001 seconds; Too many significant digits.
τ=0543.780 seconds has 6 significant digits and an implied uncertainty of ± 0.001 seconds; Too many significant digits. The first zero on the left doesn't count.
A number like 540 is ambiguous. It could be 540 ± 10 or 540 ± 1. Better as 5.40 x 10² implying an uncertainty of ± 1, or 5.4 x 10² implying an uncertainty of ± 10.
Repeated measurements of the same thing can be used to calculate uncertainty using standard deviation rather than implying it by the number of significant digits.
Uncertainty can also be estimated using propagation of all known errors.
Precision is measured by how close to the same value your measurements are, irregardless if they are the correct value.
Accuracy is how close to the correct answer your average of all measurements is.
It's possible to be very precise but have the wrong answer.
The best of all is when accuracy and precision work together.
Week 11: April 8 2024
When finished with assignment 8, we'll move on to assignment 9, pressure sensors.
BMP280 wire diagram. Note that Arduino 5 V pin is connected to the BME280 Vin terminal.
Arduino pin 4 = SDA, Arduino pin 5 = SCL. BME280 SCK=SCL SDI=SDA.
Analog pressure sensor wiring schematic.
Continue with part 4 of assignment 8, thermistor temperature sensor,
Here's the sketch.
The Tinkercad model for part 4. The variable resistor (called a potentiometer) is used to simulate the thermistor since Tinkercad doesn't have a thermistor part.
It also demonstrates the idea of a voltage divider circuit used to measure variable resistance sensor response.
|
|
Week 10: April 1 2024
Friday: Make sure everyone has their data analyzed for response times for the TMP36 sensor, and start part 4, thermistor temperature sensor.
We will do temperature measurements for homework 8, parts 3 and 4.
We will use Tinkercad to model part 3 before doing it. Here's the sketch.
The Tinkercad model for part 4. The variable resistor (called a potentiometer) is used to simulate the thermistor.
It also demonstrates the idea of a voltage divider circuit used to measure variable resistance sensor response.
This is a guide for reading data into Excel and making a graph for the next step.
This is a guide for obtaining the response times for a sensor and plotting it with measurements.
These examples are from photoresistor measurements, but the same procedure and model applies for the temperature measurements.
Week 9: March 18 2024
Monday - Friday:
We will continue with homework 7 part 2.
Everyone has data , so we will continue to work with it to obtain the response time of the photoresistor.
Here's a guide for reading your data into Excel and making a graph to work with for the next step.
Here's a guide for obtaining the response times for the photoresistor with the LED turning on and off.
Week 8: March 11 2024
Wednesday and Friday:
We will continue with homework 7 part 2. New instructions for using Cool Term.
Here's a new sketch to try that averages pulses to reduce noise.
Here's a version of the new sketch for photoresistors that have an especially large response time.
We will specifically make sure everyone has measurements from the photoresistor, and have it in Excel with a plot in a separate chart sheet.
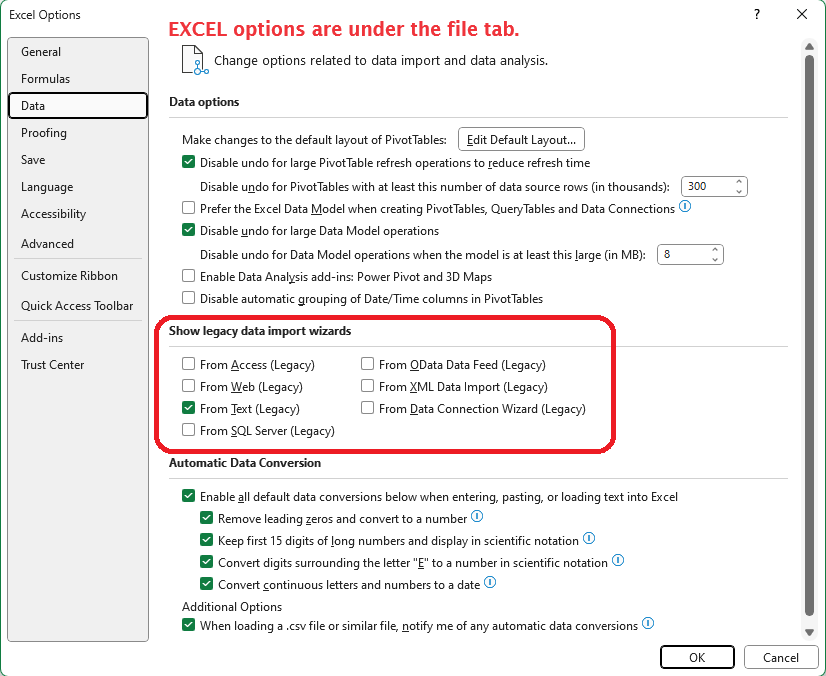
It is useful to use the "Legacy Import Data Wizard" in Excel. Find it under "File":"Options":"Data" and then click this box.
We will also use the "Solver" in Excel. Find it under "File"."Options"."Add-ins"."Manage"."Excel Add-ins":"Go..." . Then choose "Solver Add-in" and click "OK".
If your photoresistor measurements have a lot of noise, try replacing the 10 kOhm resistor with a 1 kOhm resistor (brown black red) and change the 'fixed resistance value in the Arduino sketch, near the bottom, to 1 kOhm.
Then we will go through
the process for fitting the data to the theoretical curve together.
We will
investigate several other sensors using these same procedures.
Monday:
We will continue with homework 7 part 2.
The photodiode response to LED illumination is analogous to the response of a capacitor being charged and discharged, simulated here.
Put the circuit together with the LED facing directly into the photodiode. Bend the components as needed to make this happen.
Install the sketch and view the output on the serial monitor.
We will demonstrate how to use CoolTerm for obtaining data from the Arduino, see instructions,
and will follow with putting the data into Excel for graphing and calculating the response time of the photodiode using the Solver in Excel.
Note that the photoresistance goes down as the light intensity increases.
Perlan project description.
Week 7: March 4 2024
Friday:
We will make the circuit discussed on Wednesday.
We will go over it in class for the LED blink example. Here's the sketch.
Arduino language reference.
Wednesday:
We will use TinkerCad to help learn the use of Arduino through simulation. Make a personal account.
We will go over it in class for the LED blink example. Here's the sketch.
Each lab class builds new skills based on previous classes, so it is important to attend class.
Let me know if you have to miss class so that arrangements can be made to cover material missed.
Continue with Assignment 7 on use of the Arduino microcontroller for characterization and measurements with atmospheric sensor components.
Presentation that summarizes the introduction to Arduino Uno.
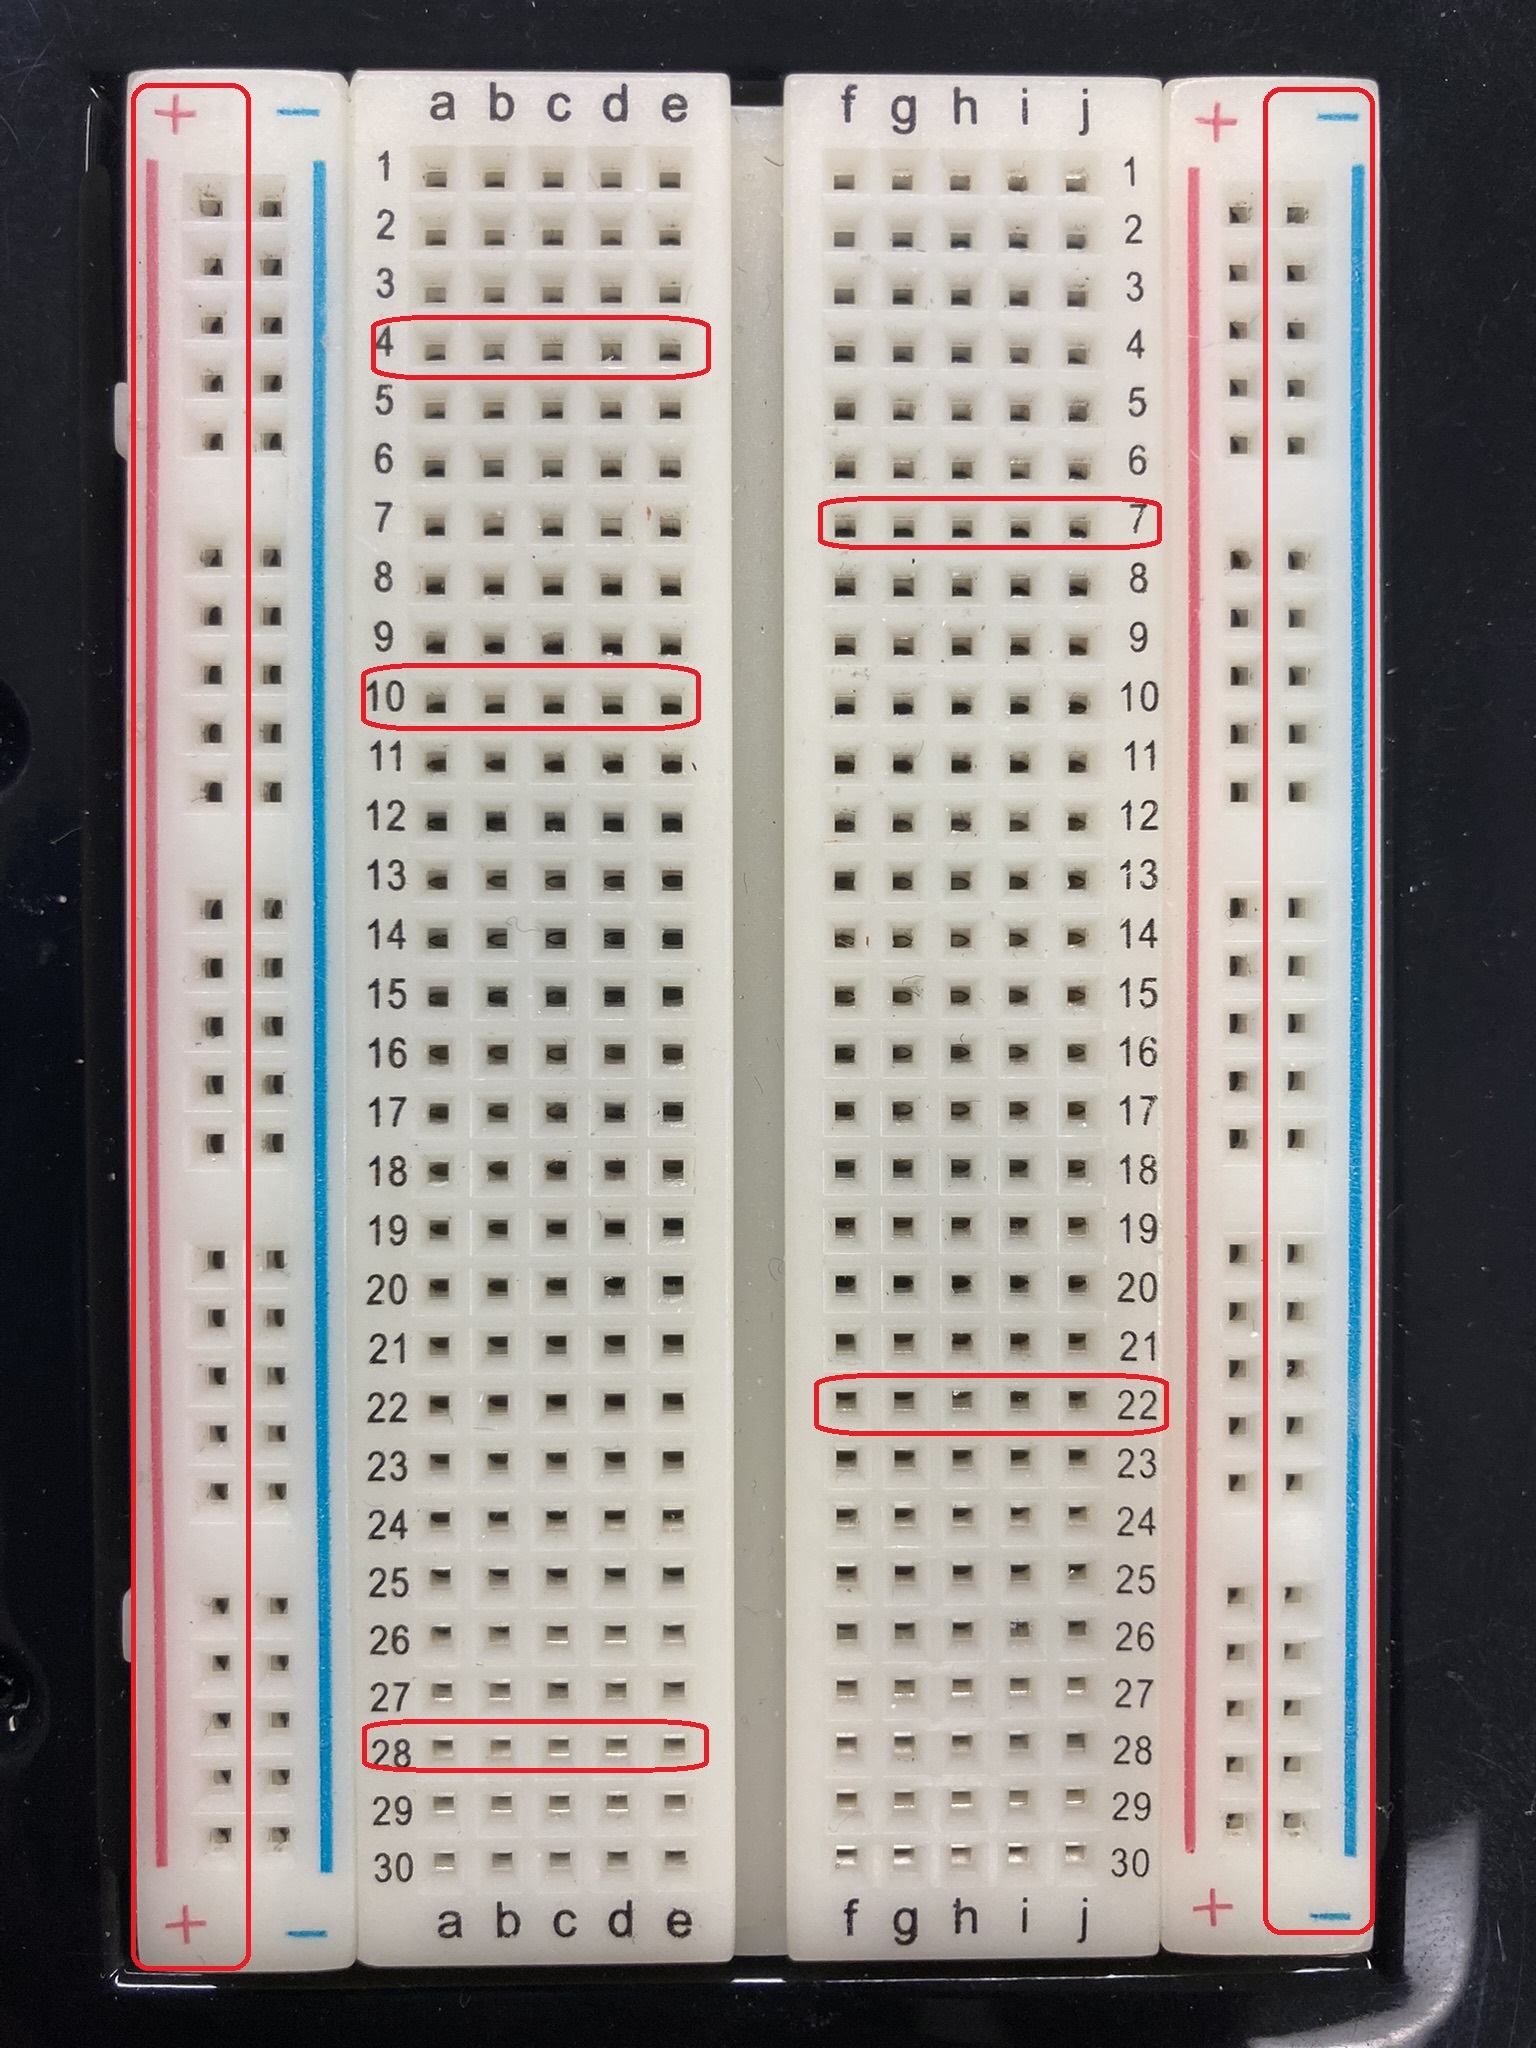
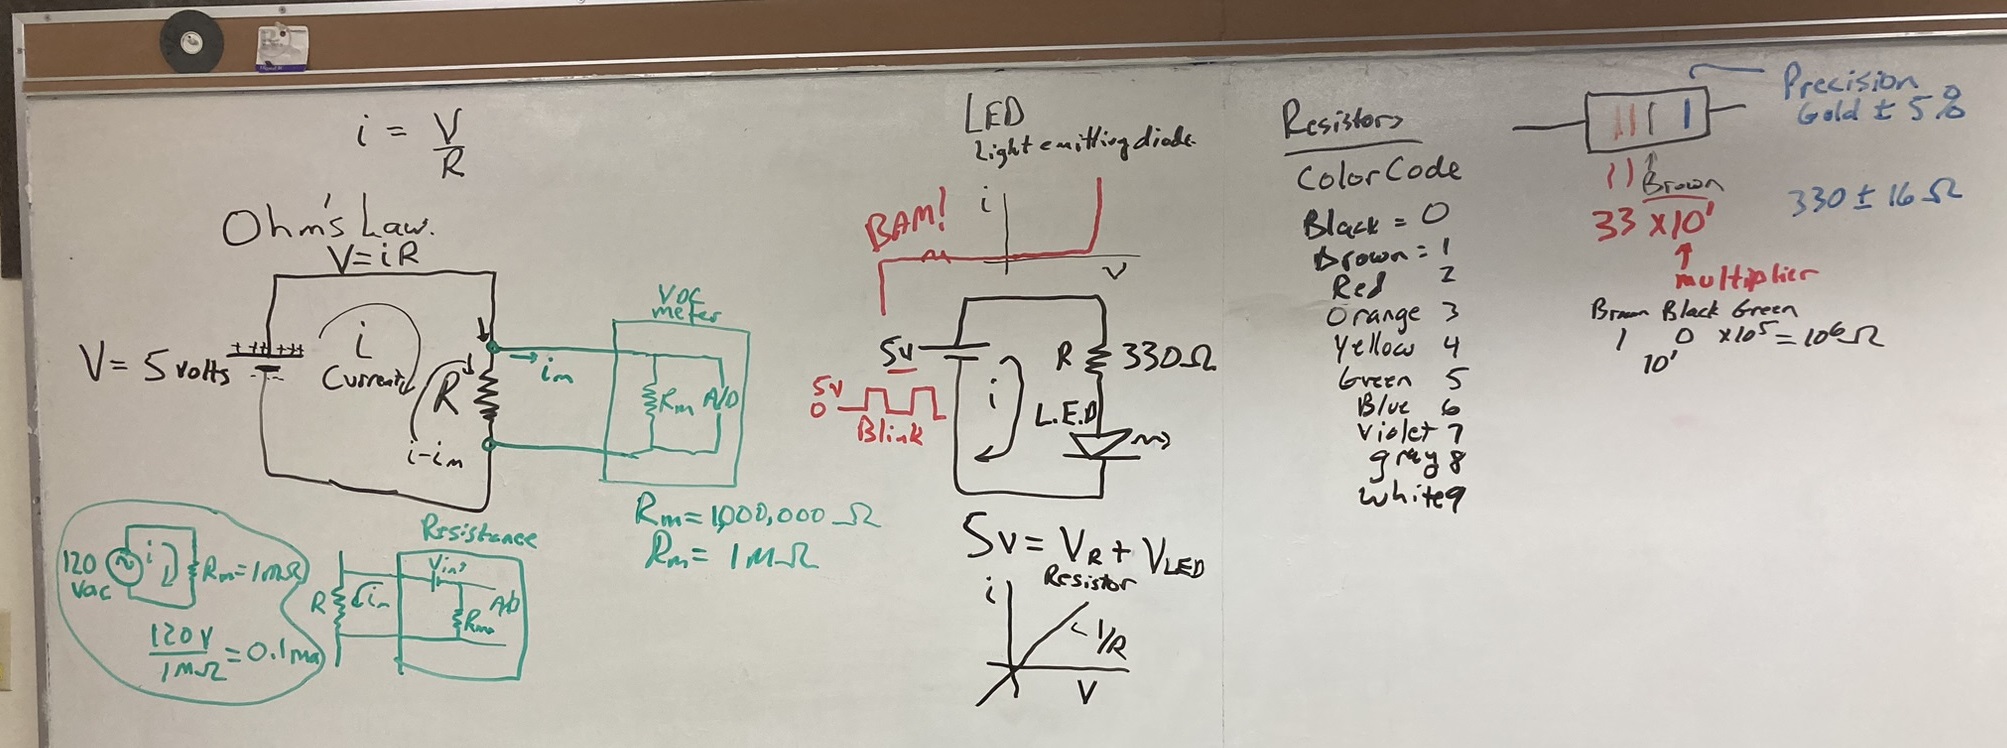
Continue getting acquainted with digital voltmeters, breadboarding, and Arduinos:
Introduce breadboarding and digital voltmeters. With the person next to you, measure the voltage used for various resistance settings, and measure the voltmeter internal resistance.
Introduce resistors and color code for resistance values.
Introduce the Arduino IDE and used it to blink the LED, the first experiment in the Vilros book.
Change the blink frequency until the light looks continuous.
Look at the signal used to drive the LED with the oscilloscope.
View and discuss modified Arduino code for simplifying the observation.
Presentation that summarizes the introduction to Arduino Uno.
Monday: UNR IN_PERSON CLASSES DELAYED UNTIL 10 a.m. WE WILL MEET THROUGH ZOOM INSTEAD.
Some topics:
The Arduino site, place to download software among other things.
Arduino information and sensor descriptions we will use in class.
Presentation on Arduino.
Photoresistor presentation for Assignment 7 part 2.
Find out more: Intro to electronics.
Week 6: February 26 2024
Undergraduate research opportunity: NSF $4,000 scholarships available for summer or fall semesters, based on success of student-driven, faculty-mentored research proposal to work on a problem of your choosing. Due on March 8th.
Friday:
Begin on Assignment 7 on use of the Arduino microcontroller for characterization and measurements with atmospheric sensor components.
Presentation that summarizes the introduction to Arduino Uno.
Wednesday:
Visit a few labs to view atmospheric instrumentation. Here's the micropulse lidar data for the instrument we saw on the roof.
Monday: A guest speaker (a UNR ATMS and Physics graduate that's working with me on a project) will discuss how and why we measure aerosol light absorption and scattering using photoacoustic spectroscopy. It's a good time to ask questions about senior research, etc, also.
Here is his presentation.
Get acquainted with digital voltmeters, breadboarding, and Arduinos:
Introduce breadboarding and digital voltmeters. With the person next to you, measure the voltage used for various resistance settings, and measure the voltmeter internal resistance.
Introduce resistors and color code for resistance values.
Introduce the Arduino IDE and used it to blink the LED, the first experiment in the Vilros book.
Change the blink frequency until the light looks continuous.
Look at the signal used to drive the LED with the oscilloscope.
View and discuss modified Arduino code for simplifying the observation.
Presentation that summarizes the introduction to Arduino Uno.
 |
 |
Week 5: February 19 2024
This week: Continue with Homework 6. Finish with an demonstration of infrared radiation, related to the channel 13 infrared imagery we used in this assignment.
Wednesday and Friday: We will continue with presentations. Reach out if you have questions.
Week 4: February 12 2024
Detailed instructions for obtaining radar and satellite data has been added to the description of Assignment 6 on the homework page near the bottom under Resources.
Send me an email if you would like to work in the lab outside of class time, or want to meet through Zoom for this assignment.
This week: Continue with Homework 6. Make sure you have a notorious weather event chosen as described in Homework 6 part 2.
We will start presentations on Friday.
Note: On Part 2, be sure to use the archived radar data tool first before using the Weather and Climate Toolkit to obtain detailed radar data so that you can make sure of the time in UTC for your location has an active precipitation event.
Friday:.
Presentations begin. Time duration should be between roughly 10 minutes to 20 minutes. Reach out by email if you have questions before then.Wednesday:
If you've finished your presentation development you can bring it to class and look it over with me and/or other students. Feel free to add in additional meteorology or weather reports to help tell your story.
If you're finishing your presentation and have questions, bring them to class on Wednesday.
A demonstration is planned for how infrared radiation is used in the atmosphere to measure cloud top temperature and other atmospheric properties.
Monday:
Update on student progess for Part 1 and start on Part 2 of assignment 6.
Review time zones and conversion between UTC and local standard and daylight savings time.
Briefly discuss and interpret the GOES Channel 13 clean IR imagery being used for the case study in part 2.
Examples of part 2 analysis: Base reflectivity, base radial velocity, base correlation coefficient, IR cloud imagery during the snow storm on 4 Feb. 2024 from 10 am to 12 pm Reno local time, or 18:00z to 20:00z in UTC.
Week 3: 5 February 2024
Send me an email if you would like to work in the lab outside of class time.
Note: Class will be held through Zoom on Monday February 5th due to the snow storm.
Monday's Zoom class was recorded, see the Zoom link in WebCampus.
This week: Homework 6. Prepare by identifying a notorious weather event as described in Homework 6 part 2.
Wednesday and Friday:
Update on student progess for Part 1 and start on Part 2 of assignment 6.
Examples of part 2 analysis: Base reflectivity, base radial velocity, base correlation coefficient, IR cloud imagery during the snow storm on 4 Feb. 2024 from 10 am to 12 pm Reno local time.
Monday:
Part 1 of assignment 6. We will demonstrate how to do Part 1 of assignment 6 by using the Reno radar.
For the homework assignment you will choose another radar, one with precip happening when you acquire your data for it.
Here is the class example for the Reno radar we covered today.
Geostationary Operational Environmental Satellite (GOES) overview.
National Weather Service discussion of radar, and another more in-depth discussion.
High windspeed problems with the nexrad radar due to aliasing. Equations and text backup.
Range folding in radar echos.
Week 2: 29 January 2024
This week: Continue the radar discussion, look at radar data, and begin homework 6.
Monday, Wednesday, and Friday:
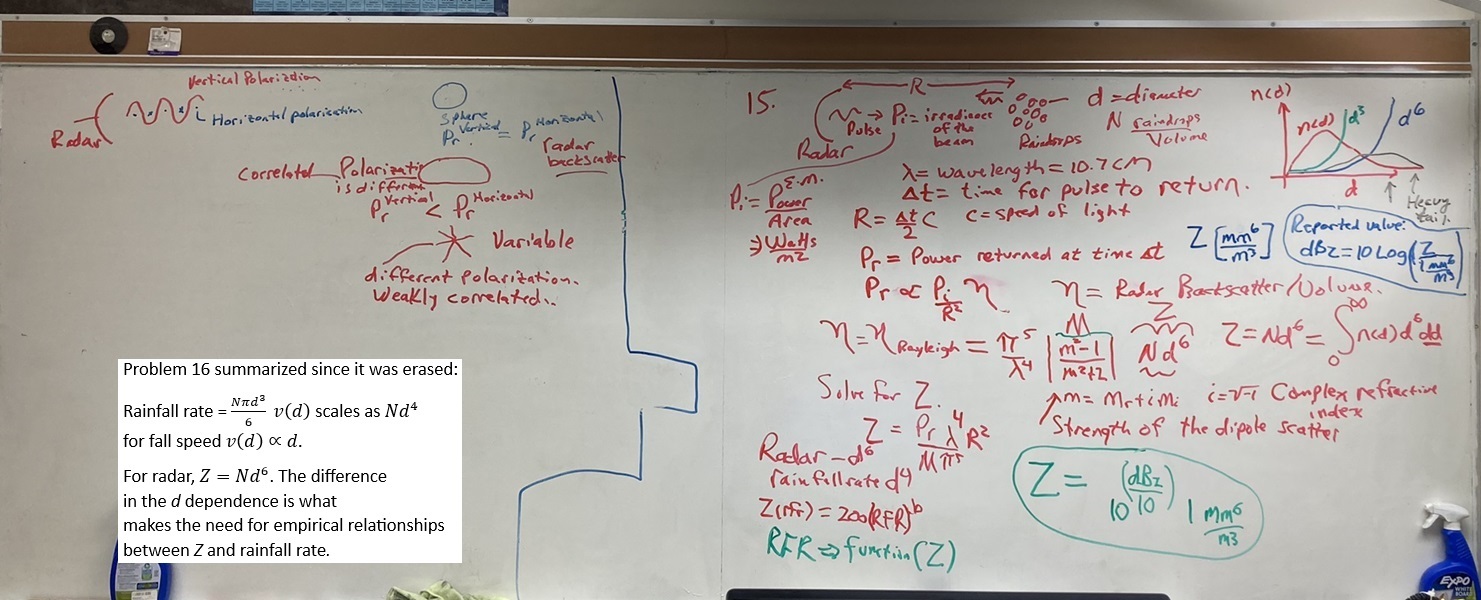
Weather radar presentation as powerpoint and as a pdf document for understanding radar, dbZ, dual polarization benefits, and Doppler wind measurements.
Needed for homework 5 and 6. Updated versions of these were made on 1/31.
Optional preparation and supplemental learning:
Notes on differential polarization and the correlation coefficient associated with it.
Meteorological information obtained from dual polarization measurements. (local backup).
Week 1: 22 January 2024
Friday:
Finish Assignment 5, meteorological radar. We didn't cover the Doppler signal question; it is for to measuring wind speed along the direction of the radar beam.
We'll have more details next week.
Optional preparation and supplemental learning: Notes on differential polarization and the correlation coefficient associated with it.
Weather radar presentation as powerpoint and as a pdf document for understanding radar and dbZ.
Needed for homework 5 and 6.
 |
Wednesday:
Continue with Assignment 5, meteorological radar.
Optional preparation and supplemental learning: Radar discussion and "under the dome" video.
 |
Monday:
Introductions: Name, major, and goals for this class.
Places to learn about what is going on in this class:
Daily Notes (here).
Assignments. Assignments 1-6 have been posted, review them.
Syllabus.
Webcampus.
First assignments are on meteorological radar:
Radar measurements of precipitation and air motion are very important and central to atmospheric science.
Example of current data.
Opportunity:
NASA EPSCOR UNR undergrad research scholarship opportunity.
A free, online Atmospheric Science textbook is available for students new to the field.
Free online Introductory Textbook for Atmospheric Science and local backup.
How to keep a lab notebook to record what you do and help in lab report writing:
a. Make a table of contents at the back.
b. Number the pages so you can add entries to the table of content.
Discussion of lab notebooking from CU.
Weather radar presentation as powerpoint and as a pdf document for understanding radar and dbZ.
Needed for homework 5 and 6.
 |
Notes on differential polarization and the correlation coefficient associated with it.
Great discussion of radar and its applications. (local backup)
What's under the dome?
Example of current radar data.
Wiki radar discussion.
Atmospheric Instruments used at the DOE ARM meteorological/climate studies sites.
Measurement uncertainty and local backup.