Week Final Day: 11 May 7:30 am to 9:30 am
Prepare your presentations for about 16 minutes with 4 minutes for questions and transition.
Here is the order for the presentations.
1. Lockin amplifier and a/d converter group presentation.
2. Sunphotometer/aperture group .
3. FTIR and spectrometer group presentation.
4. Radon Detector group presentation odp.
5. Theremin group presentation.
6. Pressure group presentation.
7. Disdrometer group presented on 4 May 2010. Here is their labview code for the oscilloscope.
8. Wind energy group presented on 4 May 2010.
Week 14: 27-29 April
Prepare presentations for final project. Here is a template for your presentation.
Use powerpoint for your presentation. In powerpoint there are note pages; use them to fill in the words for your project.
a. Describe what you have done (purpose? What phenomena did you investigate?). Describe what you developed to make it happen (soldered electronics on board, etc).
b. How does your sensor work? Describe its parts (bring it to the presentation perhaps. Also, take photographs of it.)
b. Where were your measurements taken? What did you develop?
c. What are your results? What does your measurements show?
d. Conclusion and suggestion for future work.
We will have two presentations on the last day of class (volunteers?) and 4 on the day of the final exam (May 11th).
Yow! Check out the sounding on 27 April 2010 a.m.!
And local surface winds!!
Week 8: 8-15 March
Thursday:
Air motions.
Ultrasonic anemometer for measuring wind speed at a 'fast' rate. Demonstration.
Group assignments!
Tuesday:
Continue with radar. The radar basics site below and the frequently asked questions site may help understand the topic as well.
Section on radar remote sensing: Introduction and Details. Radar homework assigned. We will take the shortest path to dbZ. Read this website. Look at our current radar loop.
Radar basics site. Weather radar frequently asked questions.
Week 7: 1-5 March
Tuesday:
If you have Excel on your laptop, bring it to class on Tuesday. We will go through some of the pitfalls people have with using it, and will give an example of how to use some of the database functions for diurnal averages and the like. If you have issues with doing the sun photometer homework, bring them too.
Starting file: Sunphotometer example.
Data base use example.
We will use data from the UNR ground based weather station operated by the DRI.
UNR weather data, daily, long term
Thursday:
Section on radar remote sensing: Introduction and Details. Radar homework assigned. We will take the shortest path to dbZ. Read this website. Look at our current radar loop.
Radar basics site. Weather radar frequently asked questions.
Week 6: 22-26 February
NOTE: Be sure to work on the homework 2 for Thursday's class. Bring your questions to class. If you are having trouble analyzing the data, bring your laptop and we'll go through it in class, towards the end. Here is what I got for the bounding air mass.
| Local Time 18Feb10 |
Solar Altitude |
air mass |
| 8:00 a.m. |
12.273 |
4.704 |
| 9:15 a.m. |
24.318 |
2.428 |
Rayleigh scattering coefficient and optical depth calculator.
Tuesday: We will meet in the class room as usual, and discuss sun photometry and the measurements from the previous Thursday
a. Basic theory.
b. Sun photometry presentation.
More Details:
c. Atmospheric Transmission.
d. Absorption by Atmospheric Gases.
e. NASA Aeronet sun photometer network. Based on the Cimel sun photometer.
Tuesday: We will meet in the Knowledge Center RM 114 for more use of the circuit board layout software. You may want to install it on your home machine too. We will also look at the machine drawing software too, and you can install it as well. You may also want to download the sound card spectrum analyzer too. You will need to install the runtime engine also.
Atmospheric IR calculator.
BLUE SKY, BLUE WATER
Week 5: 15-19 February
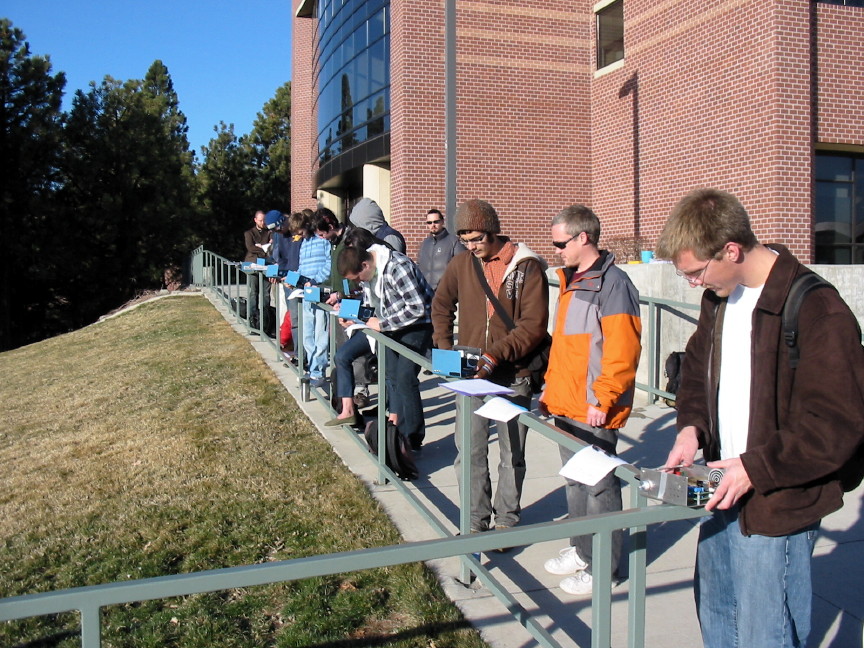
THURSDAY FEBRUARY 18th. SUNSHINE ON MY SHOULDER!!! IMPROMPTU SUN PHOTOMETER MEASUREMENT DAY!!! WEAR YOUR COAT TO SCHOOL, WE'LL COMMENCE TO MAKE MEASUREMENTS OF THE OPTICAL DEPTH OF THE ATMOSPHERE.
sunphotometer data sheet.
ATTENTION LAPTOP OWNERS:
If you can bring your laptop to class next week it would be very helpful. Please install this free circuit board layout software. You may also want to download the sound card spectrum analyzer too. You will need to install the runtime engine also.
Goals for this week:
1. Circuit board layout software use.
2. Sun photometery: where do all those photons from the sun go? How can we use them to learn about the atmosphere?
a. Basic theory.
b. Sun photometry presentation.
More Details:
c. Atmospheric Transmission.
d. Absorption by Atmospheric Gases.
e. NASA Aeronet sun photometer network. Based on the Cimel sun photometer.
NOTES:
The electronics lab is due on the 18th of February.
A sun photometery homework is assigned. See the homework section.
Week 4: 8-12 February
ATTENTION LAPTOP OWNERS:
If you can bring your laptop to class next week it would be very helpful. Please install this free circuit board layout software. You may also want to download the sound card spectrum analyzer too.
Goals for this week:
1. Use LEDs as detectors.
a. Circuit 1. Very simple resistor and LED circuit.
b. Use the operational amplifier as a transimpedance amplifier.
c. Discuss sun photometry using LEDs as detectors.
d. Discuss Atmospheric Radiance and Irradiance.
e. Discuss how to use LEDs to measure spectral irradiance.
We will continue to do a basic circuit laboratory together.
Basic operational amplifier theory.
Results: Spectrometer files for LED spectra for folks in week 3.
Fun Stuff:
Photoresistor made of Cadmium Sulfide. Controlling audio frequency with photoresistor circuit.
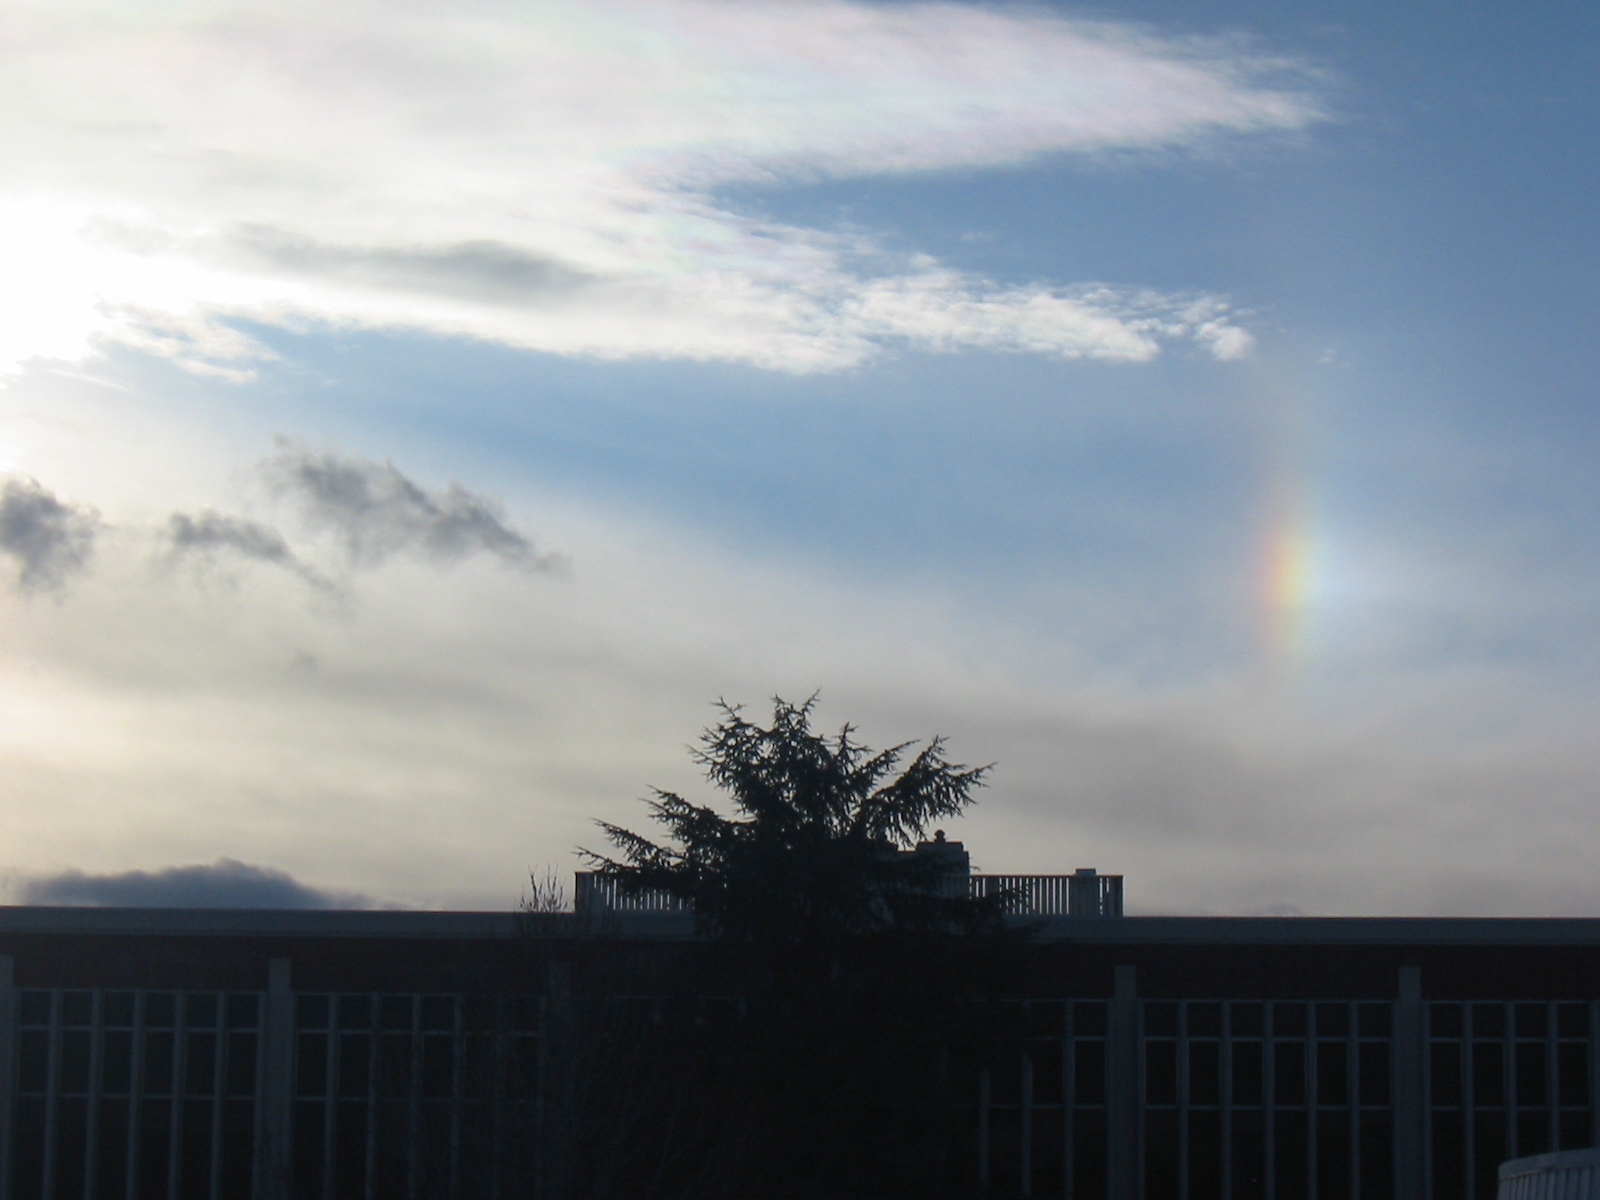
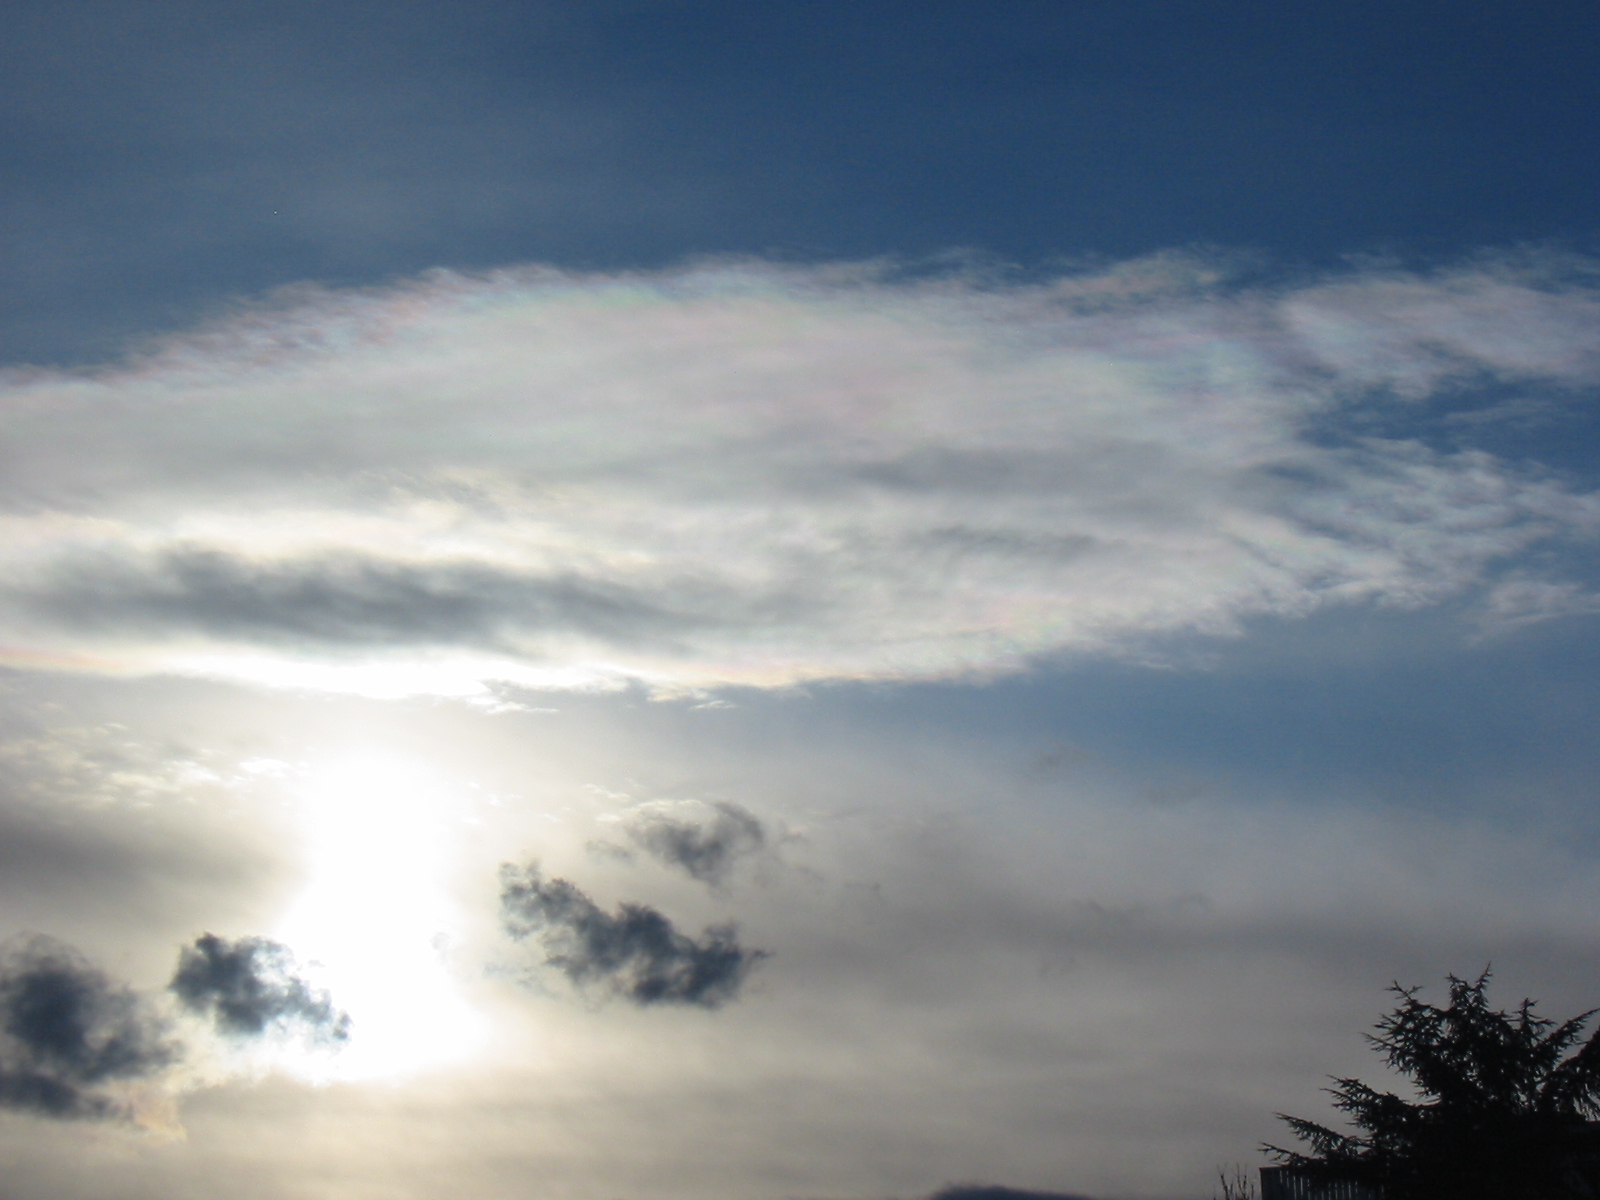
Sundog image and cloud irridescence image from my office window. (sundog and cloud irridescence.)
Week 3: 1-5 February
Results: Spectrometer files for folks early in the week.
Diffraction gratings site1 site2, Ocean Optics Spectrometer basics
Related: Cloud iridescence, demonstrate diffraction with a laser pointer and a hair strand.
Eye response and local backup. LED and laser diode response examples.
We will continue to do a basic circuit laboratory together.
Basic operational amplifier theory.
Simple view of a time constant for an resistive, capacitive element circuit.
Light emitting diodes.
Example of a project measuring color of objects using LEDs as sources.
Using an LED as a detector, measuring its spectral response.
Notes on LEDs.
General Solid State Device Theory.
Circuit components smörgåsbord.
Quiz.
Photoresistor made of Cadmium Sulfide. Controlling audio frequency with photoresistor circuit.
Week 2: 25-29 January
We will continue to do a basic circuit laboratory together.
Resistor Color Code.
Basic operational amplifier theory.
Thermistors.
Simple view of a time constant for an resistive, capacitive element circuit.
Why are temperature measurements important? An example from UNR and DRI.
(Great data source for surface weather: Western Regional Climate Center of DRI).
Begin to formulate ideas for your project; see examples. See the light to frequency converter; simple light Theremin.
Week 1: 18-22 January (circuits online textbook)
Introductions. Syllabus.
Why? Earth's radiation balance from this source.
Overview: Atmospheric Sciences relies heavily on measurements and models!
Two examples: Snow grain size study using microwave and near IR; LIDAR over Mexico City from aircraft.
We will do a basic circuit laboratory together.
Resistor Color Code.
Basic operational amplifier theory.
Thermistors.