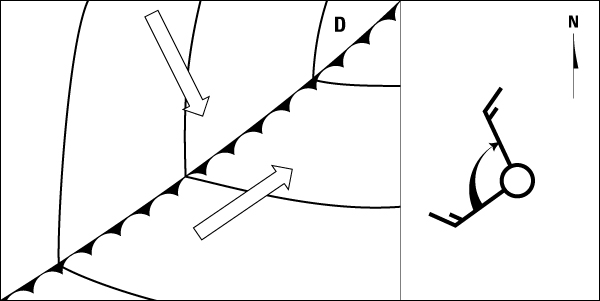
Cold front looking down at the Earth. Warm air from the southwest is displaced by cold air from the northwest.
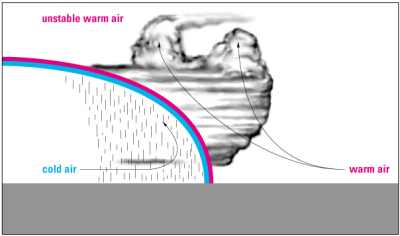 Cold front wedges cold air up, creating clouds and precipitation.
 Final Presentations May 9th at 7:30 a.m. 2 or 3 Project Presentations
Need 2 or 3 groups to volunteer for a presentation on this day. Provide me with a title and authors.
Plan for 1/2 hour presentations.
Week 15: 5 May 2 or 3 Project Presentations
Jeremy and Alex will do presentations, along with Madhu (tracking sun photometry with LEDs and spectral sun photometry, respectively).
Plan for 1/2 hour presentations.
Week 14: 28 April - 2 May
29 April, the lab will be open at 8 am for work.
1 May, class will be held from 9:30 until 10:45.
Data analysis from our measurements of the last week.
Photos from our measurements on 17 April 2008.
Photos from our measurements on 24 April 2008.
Air motions: Time series averages and Fourier analysis. New data was taken overnight.
Spectral sunphotometer and Radiance Detector: Reflectance calculations for various targets. Sun photometer, new data on 30 April 08.
Auto tracking 4 channel sun photometer: Evaluate data from last 2 times, set up more measurements (on the roof).
FTIR: Plot data. Look at strong CO2 region for meteorology. Look at atmospheric window region for column water vapor estimate. Combine with column water vapor estimate from spectral sun photometer measurements, and radiosonde data from the NWS at 4 am and 4pm.
In Situ Aerosol Optics: Finish particle based calibrations, and do ambient measurements.
Weather fronts (images from this link):
Cold front looking down at the Earth. Warm air from the southwest is displaced by cold air from the northwest. |
Cold front wedges cold air up, creating clouds and precipitation. |
28-29 April weather at UNR (data from http://www.wrcc.dri.edu/weather) The western regional climate center in Reno NV.
The data is here.
 |
 |
 |
 |
Week 13: 21 April - 25 April
Thursday: Everyone who can meet at 8:00 a.m., let's do so. It looks like tomorrow will be partly cloudy and cool.
Updates: The photoacoustic instrument needs to have the 870 nm laser aligned.
The spectral sun photometer has a new sensor head arrangement on it now, that may work better.
We'll run the FTIR with the 'hot' black body cooled as low as possible to see if we can extrapolate better to the dry conditions expected tomorrow.
The tracking sunphotometer with 4 channels is ready to go.
The air motions measurements probably needs frequent downloads of data, and it might be possible to change the file name on the ultrasonic detector every 1/2 hour or so to make the file size more manageable.
Dress warm, see you tomorrow!
Tuesday, we meet in the classroom to discuss results and plan for analysis and/or further measurements.
Bring your USB memory stick to transfer data from measurement machines to your own for analysis.
Presentation with a few photos and some weather analysis from last week.
Weather forecast for UNR.
Presentation on aerosol optics and bulk carbon chemistry measurements (EC and OC).
Our measurements have their analogies in the following satellite measurements.
GOES West Satellite Images Geostationary Operational Environmental Satellite -- GOES.
(Visible = 0.65 microns. Thermal IR = 10.7 microns or 934 cm-1, IR Water Vapor = 6.5 microns or 1538 cm-1.)
Interpret the choice of wavelengths from our FTIR measurements from the ground.

Week 12: 14 April - 19 April
Tuesday, we meet at 8 am for field staging inside, and instrument preparation.
Meteorology that prevented measurements outside today. Max wind gusts were to 55 mph.
High RH in the a.m. was due to snow. The front passed by at around hour 23,
as the wind direction changed from southwest to northwesterly, and the temperature changed.

Thursday, we meet at 8 am again for measurements outside and instrument preparation.
Week 11: 7 April - 11 April
We have two outstanding speakers this week!
THURSDAY AT 5:30 PM STOUT CONFERENCE ROOM DESERT RESEARCH INSTITUTE
1. Thursday evening 5:30 pm until 7 pm, at the Desert Research Institute, Stout Conference room (use the lower parking lot on Dandini and go to main entrance on the east side of the lot). Hal Klieforth, a meteorologist from DRI, highlights Sierra Mountains Meteorology from an observational perspective, including both ground and aircraft. Hal has been associated with the Desert Research Institute since 1965, and will also discuss the history of Mountain Meteorology research in this area. He is famous in the Sierras for his knowledge of the mountains and their meteorology. Free dinner will be served. This is sponsored by the student chapter of the American Meteorological Society.
FRIDAY AT 5 PM SLH 001
2. This Friday, Dr. Michelle Thaller, Infrared Astronomer from CalTech, will be giving a public lecture in SLH 001 at 5 pm. This is the lecture hall between Physics and Chemistry. Michelle Thaller does an outstanding job helping us 'see' Infrared radiation, and provides a very lively and entertaining discussion of infrared astronomy. You can also with the Society of Physics Students at 3:45 in LP 118. The cookies will be homemade from Dr. Melodi Rodrigue. The public lecture is set up on a level where most can understand, it won't be full of higher mathematics and physics.
The NASA A-TRAIN: Constellation of Satellites used to remotely sense properties of the Earth's Atmosphere. Presentation by Madhu.
Then we begin a brief section on radiosondes launched from weather balloons to provide temperature, dew point temperature, atmospheric pressure, and winds. These sites provide introductions to these instruments and their data. Site 1, Site 2, Site 3 Comet Module.
World sites where you can get radiosonde data.
Week 10: 31 Mar - 4 April
Continue with the discussion of our measurements of the downwelling IR radiation using the Michelson interferometer.
Results from measurements on Tuesday 18 Mar 2008 (Powerpoint presentation, Data Collection).
We will roughly estimate the irradiance in the window region under clear, cirrus, and altocumulus conditions.
We will assemble the homework assignment on IR radiation into one presentation and work on understanding IR radiation more thoroughly.
Here is a draft of a particular portion of the homework assignment.
Then we begin a brief section on radiosondes launched from weather balloons to provide temperature, dew point temperature, atmospheric pressure, and winds. These sites provide introductions to these instruments and their data. Site 1, Site 2, Site 3 Comet Module.
World sites where you can get radiosonde data.
Radiosonde measurement presentation. (download movie1 and movie2). Alternatively, download all in one zip file.
Useful GIF version of a Skew T Log P plot (and local backup).
Week 9: 17 Mar - 21 Mar
Preliminary results from measurements on Tuesday 18 Mar 2008 (Powerpoint presentation, Data Collection).
Be prepared for measurements outside on Tuesday 18 March, expecting partly cloudy skies.
It looks like precip on Thursday. Contact me if you can volunteer for early morning measurements before class.
We'll have a time lapse camera, sun photometers, and the FTIR.
Powerpoint presentation Infrared Spectroscopy of the Atmosphere using an FTIR spectrometer.
Notes on spectral analysis: Comparison of diffraction gratings and interferometers.
Example of Fourier analysis using a sound card on a computer, and Labview software.
Week 8: 10 Mar - 14 Mar
Notes on spectral analysis: Comparison of diffraction gratings and interferometers.
Example of Fourier analysis using a sound card on a computer, and Labview software.
Powerpoint presentation Infrared Spectroscopy of the Atmosphere using an FTIR spectrometer.
Week 7: 3 Mar - 7 Mar
Sunlight and seasons.
Instantly double the CO2 concentration, ground perspective, and space perspective.
Infrared Spectroscopy of the Atmosphere using an FTIR spectrometer.
Week 6: 25 Feb - 29 Feb
Barbara Zielinska from the Desert Research Institute talks about Atmospheric Chemistry measurements on the 26th.
We visit her lab at DRI on the 28th. Come to class as early as possible on this day, for we will go to and return from DRI during class.
Week 5: 18 Feb - 23 Feb
Prepare for Thursday's class by looking over the circuit board layout software site, and downloading the free software.
You can look at the sunphotometer circuit board and schematic, and some of the electronic components.
Continue with sunphotometer measurements.
Continue working on the homework assignment, due on the 28th of February, 2006.
Eye response and local backup. LED and laser diode response examples.
LED as a detector of sunlight: how to interpret the measured voltage.
Sunphotometer lecture notes.
Presentation on sunphotometers and solar radiation.
Example of sunphotometer measurements on 27 June 2007.
Take a quick trip around the world and look at atmospheric radiation.
Week 4: 11 Feb - 16 Feb
Sun photometer measurements outside with simple LED based sun photometers, and with a spectrometer.
New homework assignment.
Sunphotometer lecture notes.
Presentation on sunphotometers and solar radiation.
February 12th turned out to be a great day for sun photometer measurements.
Be prepared to make measurements outside during class, dress warm, especially if we have clear skies.
Notes:
Brief description of sun photometery.
Solar and terrestrial radiation and climate.
Week 3: 5 Feb - 9 Feb
Continue with basic circuit laboratory, operational amplifiers.
LED spectra from class on the 5th of February.
Example LED and laser pointer optical spectra.
LED Spectra: Raw Data from everyone, first try. Excel Spreadsheet summary of LED spectra measurements on 31 Jan.
Diffraction gratings site1 site2, Ocean Optics Spectrometer basics
Related: Cloud iridescence, demonstrate diffraction with a laser pointer and a hair strand.
Week 2: 28 Jan - 1 Feb
Continue with...
Basic
circuit laboratory together.
Basic operational amplifier theory.
Basics of thermistors and resistors.
Psychometrics: The field of engineering concerned with the determination of physical and thermodynamic properties of gas-vapor mixtures, for our purposes, the relative humidity of air (RH).
Week 1: 21-26 Jan
Introductions. Discussed, among other things, solar and terrestrial radiation in the atmosphere.
We will do a basic circuit laboratory together. Basic operational amplifier theory. Basics of resistors.
Earth's radiation balance from http://www.atmos.ucla.edu/%7Eliougst/Academic_Courses/244A.htm
We take a first pass at notions surrounding temperature. What is temperature, how do we measure it?
Thermocouples for large temperature ranges, solids, liquids, gases.
Thermistors for modest temperature ranges. See this presentation on thermistors.
Doppler spectral width of absorption and emission lines and temperature.
Notice that we have already introduced the notion of the Maxwell-Boltzmann distribution of molecular speeds in a gas.
And then the 'simple' candle . Candle light comes from blackbody emission from heated soot particles and light emission from gases. Soot is a collection of large numbers of carbon atoms from the waxy fuel. Hydrogen burns to produce water vapor.
The sun burns hydrogen in a fusion reaction. Its core is at around 15x10^6 Kelvin.
Also, while 'nature abhors a vacuum', nature doesn't tolerate slackers -- atoms and molecules in large systems tend to share the burden of dealing with the energy available to them by shaking, rattling, and rolling along at relative speeds determined by their mass. It is a theory of parsimony, take on only the amount of energy alotted to you, no greedy fat cats, no slackers.