Click on image for larger view.
ATMS 360 Homework and Course Deliverables (return to main page)
[How to write lab report]
Assignment 4 Arduino and Atmospheric Measurements:
Title: You can decide on the title based on your experience with this lab.
Goals:
a. Become familiar with the Arduino microcontroller as an example of a programmable device for acquiring measurements and controlling systems.
b. Demonstrate ability to modify Arduino sketches for solving problems.
c. Learn about and use sensors with atmospheric relevance.
d. Learn how to bring measurements from the Arduino into computers (interface the Arduino) to acquire data for later analysis and display.
If possible, install the Arduino software on your own laptop (if you have one), and use it in class.
Also download CoolTerm and place it somewhere that you can get to it for ease of use. This program allows us to transfer data from the Arduino to the computer.
The code for the projects in the book and kit is here: expand the file and put the folder in your Arduino examples folder.
In your report, describe and/or answer these questions
1. Introduction to describe the Arduino (why is everyone so crazy about this thing?).
Measurements and Analysis
2. Do Circuit 6, pg 40 in the book to learn about the photoresistor and how to measure its output.
Then create a circuit to drive the LED at different frequencies to see if the photoresistor resistance can accurately follow the LED output for low and high frequencies.
Point the LED output directly into the photoresistor input.
You can use variable delay and the 'Blink' sketch to drive the LED.
If the LED is driven by a square wave, the photoresistance should show a crisp square wave too. Use the plot monitor on Arduino to view the photoresistor output,
and save some data with CoolTerm (including time) so that you can graph the photoresistor output from the LED drive as a function of time.
Can you estimate the time constant of the photoresistor as a sensor of light?
Here's an example sketch that may be helpful in measuring response time. You may find ways of speeding it up to get more time resolution on the LED response.
[Extra question: Does photoresistor nonlinearity play a role in its frequency response?]
3. Do Circuit 7, pg 44 in the book to be become familiar with the TMP36 temperature sensor.
What is the principle of operation of the TMP36 temperature sensor? How was its signal obtained?
Example sketch for response time measurement. Read it and follow instructions. Pinch the temperature sensor to warm it up when the LED comes on.
Record a time series with CoolTerm as you pinch the the sensor to warm it up to a steady temperature, and let it decay to a lower temperature.
Estimate the time constant for the sensor as you are warming it up with your fingers, and the time constant as you are cooling it off by letting it sit in air.
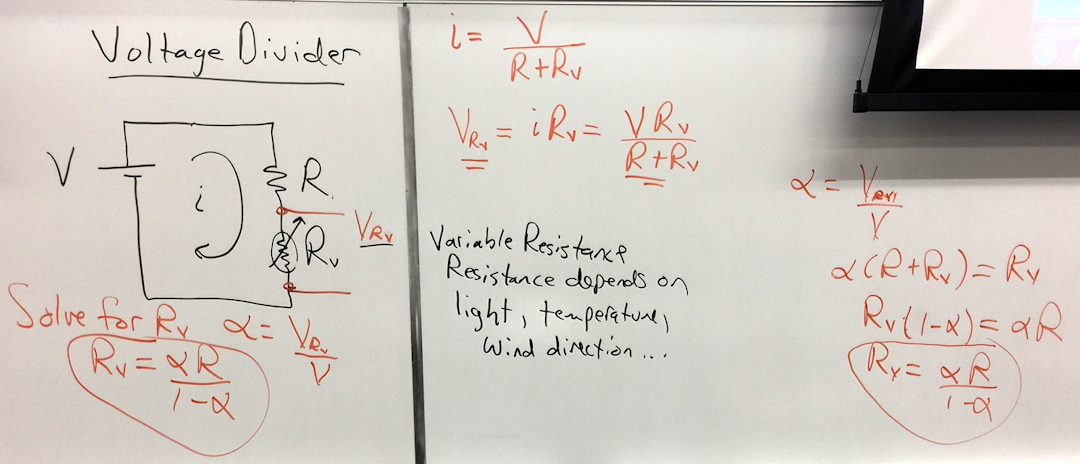
4. Create a voltage divider circuit to measure the resistance of the thermistor sensor using a fixed resistance of 1 MegOhm (1,000,000 ohms).
Calculate the temperature that corresponds to your measured resistance using the equation given here (thanks Alex).
Record a time series using CoolTerm as you pinch the the sensor to warm it up to a steady temperature, and let it decay to a lower temperature.
Estimate the time constant for the sensor as you are warming it up with your fingers, and the time constant as you are cooling it off by letting it sit in air.
Here's an example sketch to use for the thermistor sensor evaluation. Read the sketch for instructions on what to do.
Pinch the thermistor carefully (without affecting the wires) when the LED is on.
5. Set up a circuit and sketch to acquire data from the pressure sensor. Do appropriate data averaging so that you can easily tell the pressure difference
between having the sensor on the desk, and having the sensor about 1 meter higher or lower. Record data with CoolTerm to demonstrate your results.
Here's an example sketch for the pressure sensor. You'll have to comment out some lines near the end to get only the pressure measurements to CoolTerm.
Technical Note: It seems the 10 bit analog to digital (a/d) converter of the Arduino would not be able to resolve a pressure difference of about 0.1 mb associated with
1 meter height difference. 1 bit change in the a/d counts corresponds to a voltage change of about 0.005 volts, and a pressure change of and about 1 mb pressure.
Dither helps: the voltage source for the Arduino is noisy enough to cause around 50 mv or so of noise so that the a/d counts fluctuate to a useful average.
The example sketch for pressure averages the measurements of the pressure sensor voltage and the voltage divider voltage about 1800 times for each measurement.
Use of the voltage divider for the power supply voltage measurement is necessary since the a/d range is 5 volts, and direct measurement might be over the measurement range.
Extra credit can be accomplished alone or in a group effort.
6. Extra credit 1: Implement the IRsensor. Interface it with Labview using the indicated code.
Demonstrate a time series of temperature from Labview by doing a screen capture. Devise a method to measure the sensor time constant.
Prepare a powerpoint presentation of your results and explain them to the class. Be sure to include a discussion of how the sensor works.
7. Extra credit 2: Devise a sketch to acquire calibrated wind sensor data from the wind sensor head. The sensor head description and circuit
is here. Wind direction is obtained from the rotation of a potentiometer. Wind speed is obtained by counting the rate of reed switch closures on the cup.
You may find it useful to modify the light to frequency sensor sketch to obtain wind speed. Demonstrate that the sensor works by acquiring
some data from it, preferrably outside, perhaps in comparison with the ultrasonic anemometer.
Add the extra credit to your report at the end. Be sure to include a discussion of how the sensor works.
Here's a local backup of the sensor head description page in case it becomes unavailable.
Resources:
Description of the Arduino and some sensors we'll use.
TMP36 temperature sensor data sheet.
Very useful voltage divider circuit to use for measuring sensors that depend on resistance.
Click on image for larger view.
Assignment 3
Title: Vertical distribution of pressure, temperature, and dew point temperature inside the DMS building, and
outside from tethered balloon measurements.
Goals:
a.
To investigate the vertical distribution of atmospheric thermodynamic properties.
b. To appreciate the time constant of sensors, and how measurement strategy needs to account for it.
c. To use custom instruments made be students in previous years to better understand the components.
d. To use a simple method (tethered party balloons) for sampling near surface atmosphere properties.
e. Gain a sense of how important balloon sampling of the atmosphere is for weather prediction.
Measurements:
We have 5 'Teensy' data cards for use in this lab. Each person should acquire their own data. You can work in groups to discuss, but each person will use their own data.
We get data off the cards using microSD cards.
a. Measure the vertical distribution of T, Tdew, and pressure in the DMS building, from the 1st to 5th floor. The seldom used stair case is useful for this.
Here's the data from the Teensy cards.
Choose data from one card for your analysis (you don't have to do them all).
You may use the DRI station pressure to see if the pressure was actually 'constant' during the time of our measurements on 8 March 2016.
If not 'constant' it may be best to estimate the height of the building stair case by using the pressure measurements near the end of class, when we descended quickly.
b. Measure the actual height of the this distance using a ruler to measure step size, and to count the number of steps. (is step size similar from step to step?)
c.
Measure the vertical distribution of T, Tdew, and pressure near the DMS building using the tethered balloon system.
Here's data
(choose one balloon launch to study, you don't have to do them all):
Measurements from the first balloon launches.
Measurements from the second balloon launches.
Measurements from the third balloon launch.
In your report:
1. Introduction to include history of balloon sampling of the atmosphere, and importance of it.
2. Measurements section should describe sensors used, see resources below.
3. Discuss indoors results, including calculation of building height from pressure measurements, and uncertainty in this measurement.
4.
Estimate the time constant of the temperature sensors from the measurements we made on the 8th of March.
5. Discuss outdoor results.
6. Extra credit: Calculate the air density as a function of height in the building and outside during the balloon launch as follows:
i. assuming dry air (RH = 0)
ii. taking into account water vapor
iii. compare these
Resources:
Pressure Sensor (Transducer)
MPX 4115 APand application note on how to filter the output
Temperature and humidity sensors made by Sensirion
Carbon dioxide sensor Telaire 6004 we may use
Pin assignments and the schematic for the Teensy microcontroller
Schematic for the card used for the pressure, temperature, RH, and CO2 measurements using the Teensy 3.1.
Sketch (program) used for acquiring data from the Teensy.
Time constant of thermistor measured using room temperature and freezer temperature (click on image for larger version). |
Literature:
National weather service upper air measurements made with balloons (complementary site).
New NOAA weather prediction super computer is now operational.
Tethered kites used to sample in the vertical.
Smart balloons for measuring along with a moving air masses.
Thermistor temperature calibration data.
Assignment 2
We will investigate atmospheric pressure measurements in this assignment.
Pressure measurements are fundamental to atmospheric science;
high pressure implying fair weather, low stormy, and pressure difference measurements at different locations
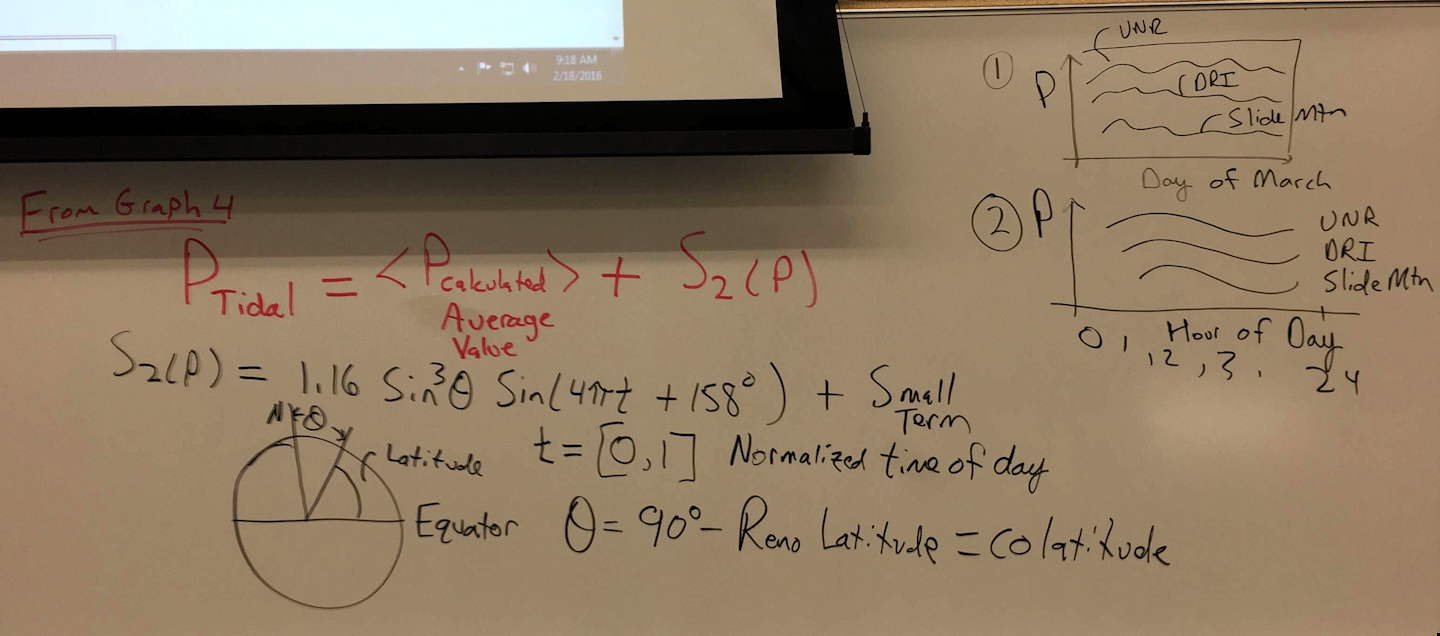
are used to understand winds, and atmospheric tides,
(here's more on tides, with the equation we'll use for it (Eq. 9.1), along with a local backup).
In this assignment we will:
 |


Summary of the graphs needed (you may add others in your report as well to further illuminate the subject): Click on them for larger versions:

Paper on atmospheric tides from this source.
| All of the Western Regional Climate Center Weather Sites | click here | |
| LOCAL WEATHER STATION DATA MANAGED BY THE WESTERN REGIONAL CLIMATE CENTER AT DRI PASSWORD IS wrcc14 | SITE DESCRIPTION | Current Data Graphs to see what's going on |
| UNR Weather Station on Valley Road | click here |
click here |
| DRI Weather Station | click here | click here |
| Slide Mountain Weather Station | click here | click here |
Weather station images looking north. Lake Tahoe is on the lower left, Pyramid Lake on the upper right. The UNR weather station is on the valley floor. Click on image for larger version. |
Assignment 1
Use data from the UNR and DRI weather stations (converted to graphical form) to answer this question.
Does Reno have temperature inversions in the first 150 meters of the atmosphere above the surface in the month of July 2015?
If so, discuss the reasons, and be sure to note any references you use in your discussion.
You can make time series and/or scatter plots of relevant meteorological data (wind speed, solar and IR radiation, etc) that helps
explain inversions.
If you find temperature inversions, calculate the average fraction of the day for an inversion, and the average value of the negative lapse rates for all inversions.
Prepare and discuss the histogram of temperature inversion.
Present your homework in discussion form, describing where you obtained your data from, and the meaning of it.
Your discussion could include a comparison of the histograms we developed in class for December 2015.
| All of the Western Regional Climate Center Weather Sites | click here | |
| LOCAL WEATHER STATION DATA MANAGED BY THE WESTERN REGIONAL CLIMATE CENTER AT DRI PASSWORD IS wrcc14 | SITE DESCRIPTION | Current Data Graphs to see what's going on |
| UNR Weather Station on Valley Road | click here |
click here |
| DRI Weather Station | click here | click here |
| Slide Mountain Weather Station | click here | click here |
Lab reports will be written the same format we use for scientific papers and for student senior, MS, and PhD theses.
One goal of this class is to work on your ability as a science writer.
Let me emphasize one word here. SCIENCE SCIENCE SCIENCE SCIENCE SCIENCE SCIENCE!!!!
So often we are obsessed with the technical details of the measurements that we don't cover the science adequately.
The following elements are needed for your lab report to be complete.
Here is an example of some hints I found using a google search with the keyword "how to write a scientific paper".
Page length doesn't matter; it's all about the contents.
Make it as short as possible to get the message across in a clear manner.
Title: The title should cover the science objective and maybe mention the instrument(s) used for the measurement.
Abstract: The abstract is a brief discussion of the findings of your work. It should be well written because it is often what is read as someone makes a decision to read your work (or fund your research).
Hint on writing abstracts.
Introduction: Explain the scientific goal in more detail and maybe hint at the measurement methods used.
Measurements: Discuss the measurement methods, including uncertainties.
Discuss the instrument(s) and the pertinent information needed to convey what you measured.
Observations: Display your observations and interpret them for your reader.
Make clear, legible graphs with large fonts, clear symbols, and clearly documented results.
Conclusions: The conclusion should summarize your observations and perhaps make suggestions for future work.
References: References refer to specific articles and/or books, etc, that you reference in your paper.
HERE IS AN EXAMPLE LAB REPORT
(Top of page) .
