Applied
Atmospheric Dynamics
Amanda H. Lynch
and John J. Cassano
Applied
Atmospheric Dynamics |
||
| Wiley Home | Higher Education Home | Title Home | ||
|
Images Storm of 2003 Projects |
Working with weather dataHow do I read a surface station report from a map? How do I find sea level pressure from the surface observations? How do I decode a US state name abbreviation? How do I work out the name and location of a station code? How do I read an upper air station report from a map? How do I interpret the wind direction information in a station data file? Working with hodographs and skew-T diagramsHow do I plot a skew-T diagram? How do I determine mixing ratio and saturation mixing ratio using a skew-T diagram? How can I represent a dry adiabatic process on a skew-T diagram? How can I represent a moist adiabatic process on a skew-T diagram? How can I find the lifting condensation level on a skew T diagram? Working with weather data Question:
How do I read a surface station report from a map? The wind speed symbols are
additive, and wind is generally reported in units of knots (1 kt = 0.51
ms-1). A short wind barb indicates a wind speed of 5 kts, a
long barb indicates a wind speed of 10 kts, and a pennant indicates a
wind speed of 50 kts. The actual wind may be within ± 2 kts of the plotted
wind speed. The wind direction is given by the angle of the line that
anchors the barbs; the direction the line points is the direction the
wind is coming from. Question:
How do I find sea level pressure from the surface observations? Question:
How do I decode a US state name abbreviation? Question:
How do I work out the name and location of a station code? At least one of these type of identifiers is associated with each station around the world. A large number of stations have both an index number and a location indicator assigned to them. On this CD ROM we use a three letter identifier. So, for example, "PGA" is Page Municipal Airport in Arizona. More information is available from the US National Weather Service, and a complete listing (which you can search using "Find in this Page" in your browser) of all stations around the globe in order of ICAO station indicator is here. Alternatively, you can search for specific stations in the United States and around the globe at US NWS Station Information web page. In all cases, it is very useful
to combine this information with a detailed map from an atlas or an online
service such as Google Earth or
Mapquest. Question:
How do I read an upper air station report from a map? On upper pressure level maps,
the temperature is always plotted with units of oC throughout
the world, and as for surface weather maps is plotted in the upper left
corner of the station model. The dew point depression, rather than the
dew point temperature, is plotted in the lower left corner of the station
model. The central circle of the station model is filled if the dew point
depression is less than 5oC, since a small dew point depression
is indicative of areas that may be cloudy. Otherwise, the circle is left
unfilled. In the top right quadrant, the height of the pressure surface
in decameters is reported. The wind speed and direction is reported as
for the surface maps. Question:
How do I interpret the wind direction information in a station data file?
Question:
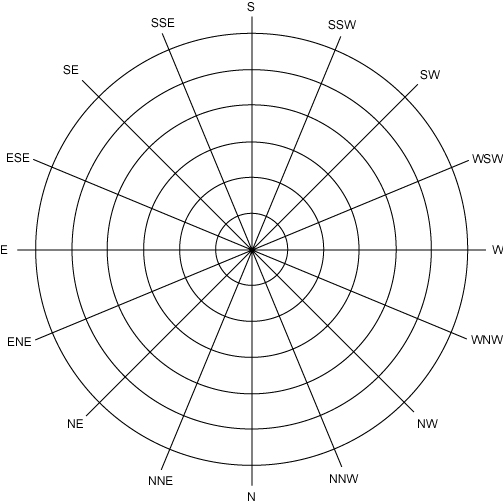
How do I plot a hodograph? The wind direction given by meteorologists indicates the direction that the wind is coming from. Wind directions given by numerical values have the following geographic directions: 90o=East, 180o=South, 270o=West, and 360o=North, with intermediate numerical values corresponding to intermediate directions. To make the hodograph, label the wind speed rings on the blank diagram with values appropriate for the data you are using. Then, for each height level, place a dot on the graph at the appropriate wind speed (given by the circles) and wind direction (given by the radial lines). Note that the wind directions plotted on the hodograph are the opposite to that which is normally used: a North wind is plotted at the bottom of the hodograph, and you proceed counter clockwise to East, South, and West. This convention is used so that the final plot on the hodograph indicates the direction the wind is going towards. When you have placed all the
dots, draw a line joining the dots from the surface point to the upper
most point. Question:
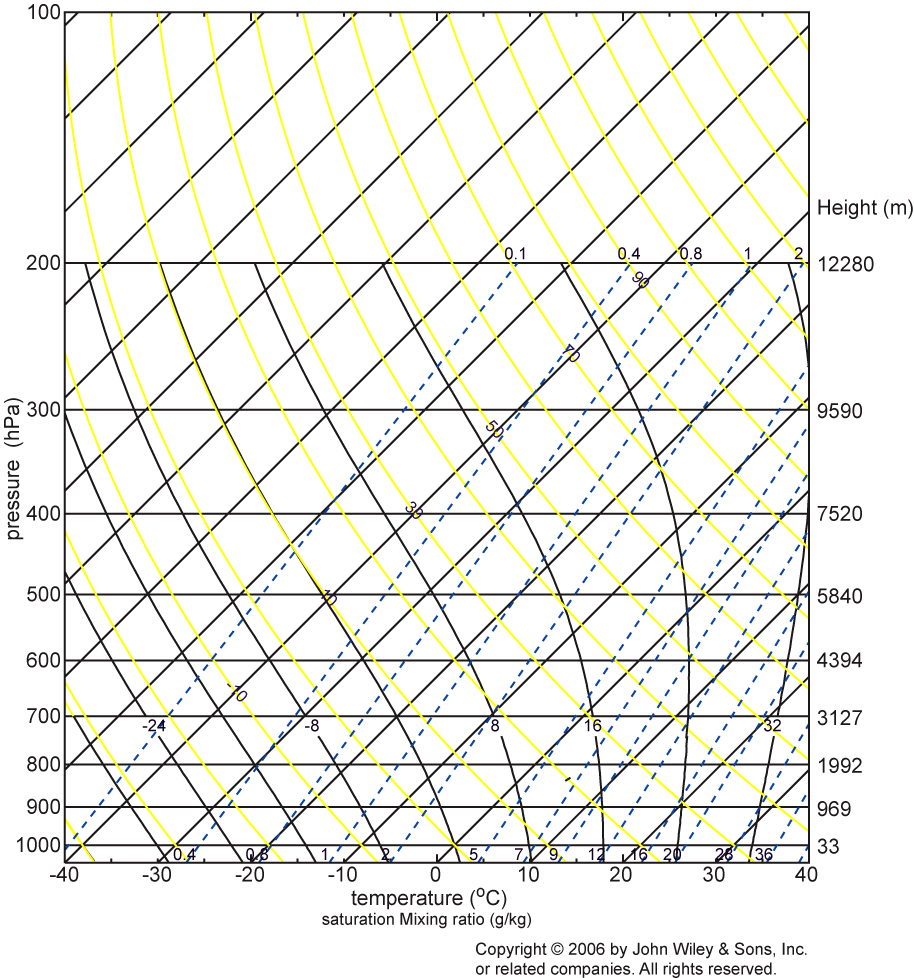
How do I plot a skew-T diagram? Skew T-log P diagrams, often referred to simply as skew T diagrams, are commonly used by meteorologists to diagnose the structure of the atmosphere at a particular location and to determine how air parcels will be modified due to ascent or descent. The logarithm of pressure is used as the vertical axis of the plot, and temperature is plotted using an axis that is skewed at a 45o angle to the horizontal (hence the name of the diagram). Lines of constant temperature (isotherms) are shown as black lines that slope up and towards the right on the diagram. The saturation mixing ratio is also accorded a skewed axis, and lines of constant saturation mixing ratio are shown by blue dashed lines that slope up and towards the right on the diagram. Lines that represent dry adiabatic processes (dry adiabats) are shown by yellow lines sloping up and towards the left, while lines that represent moist adiabatic processes (moist adiabats) are shown as curved black lines on the diagram. To plot sounding data on a skew T diagram, place a dot on graph at the appropriate temperature for each pressure level in your data. Do the same for the dew point temperature if it is known. When you have placed all of the dots, draw a line joining the dots from the highest pressure (the surface) to the lowest pressure for each temperature point plotted. Repeat this for the dewpoint temperature. The resulting diagram will have two lines plotted that represent the vertical variation of temperature and dewpoint temperature in the atmosphere. Question: How do I determine mixing ratio and saturation mixing ratio using a skew T diagram?
Question: How can I represent a dry adiabatic process on a skew T diagram?
The dew point temperature of the air parcel will also change as the parcel experiences a dry adiabatic process. First, we note that during a dry adiabatic process the total amount of water vapor in the air parcel remains constant, and thus the mixing ratio will also remain constant. The mixing ratio of an air parcel is given by the intersection of the mixing ratio lines with the parcel dew point temperature and pressure. The mixing ratio lines are plotted on the skew T diagram as blue dashed lines that slope up and towards the right. To represent the conservation of mixing ratio draw a line that starts at the value of the initial mixing ratio and is parallel to the mixing ratio lines on the skew T diagram. Each point along this line has a constant mixing ratio and defines the dew point temperature and pressure of the air parcel as it undergoes a dry adiabatic process. As long as the dew point temperature is less than the temperature the air parcel will remain unsaturated. See How can I represent a moist adiabatic process on a skew T diagram? to find out how to determine how the temperature and dew point temperature of a saturated air parcel will change as it is lifted. Question: How can I represent a moist adiabatic process on a skew T diagram?
Question: How can I find the lifting condensation level on a skew T diagram?
|
Toolbox
|
|
Legal Disclaimer | Privacy Policy | ©2006 John Wiley & Sons, Inc. All Rights Reserved |