|
Images
Storm of 2003
Projects
|
Chapter 11: Clouds
and Severe Weather
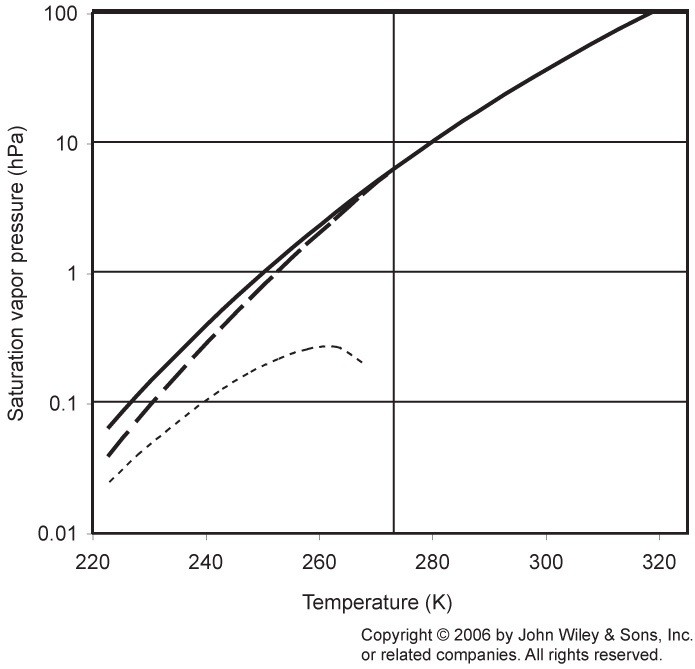
- Figure
11.1
The saturation vapor pressure with respect to both water (solid line)
and ice (dashed line), and the difference between them (dotted line), calculated using the Goff-Gratch equation. The vertical
line indicates the freezing temperature.
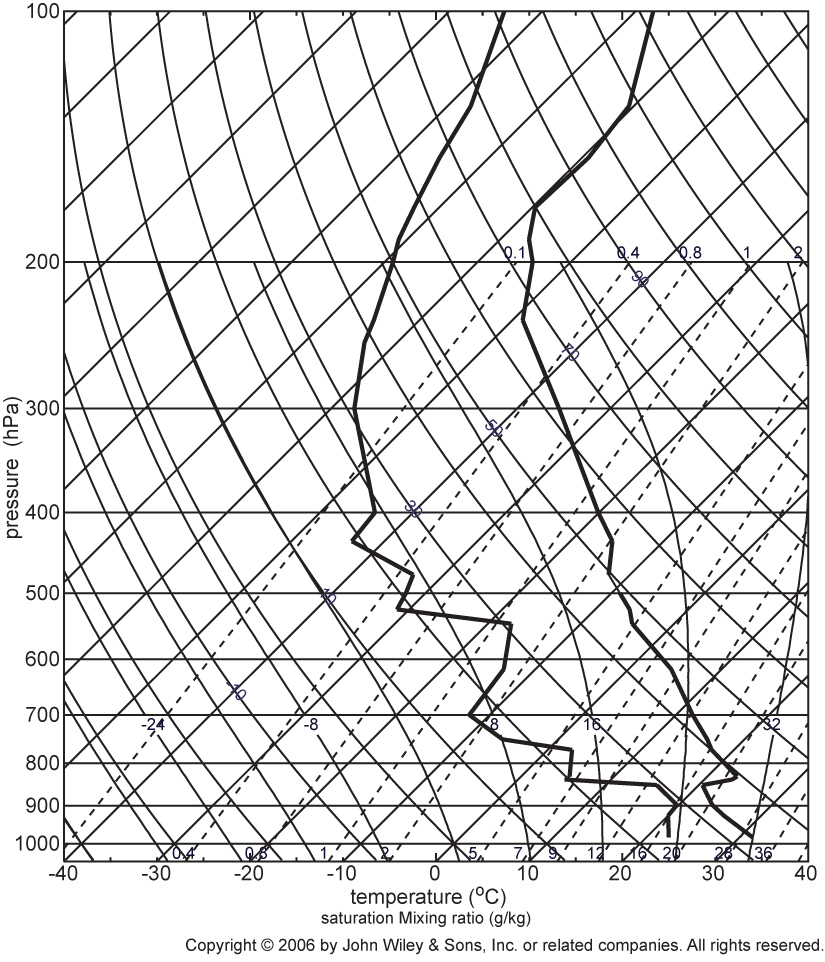
- Figure
11.2
"Skew T log P" diagram for a sounding taken at Fort Worth, Texas,
on 5th June 2005 at 00 UTC, showing the temperature and dew point temperature profiles.
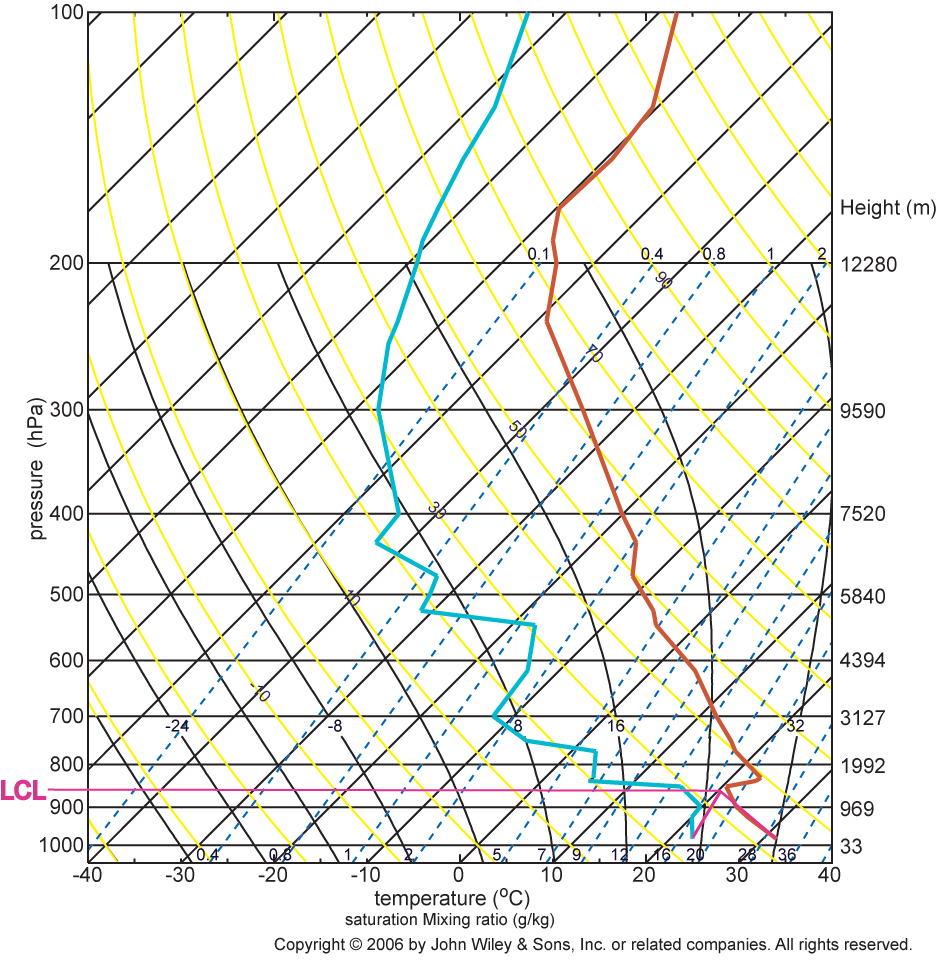
- Figure
11.2, including LCL calculation
"Skew T log P" diagram for a sounding taken at Fort Worth, Texas, on 5th
June 2005 at 00 UTC, showing the temperature (red) and dew point temperature (cyan) profiles, and the lifting condensation level (fuschia)
calculated using the dry adiabats (solid yellow) and the saturation mixing ratio lines (dashed blue).
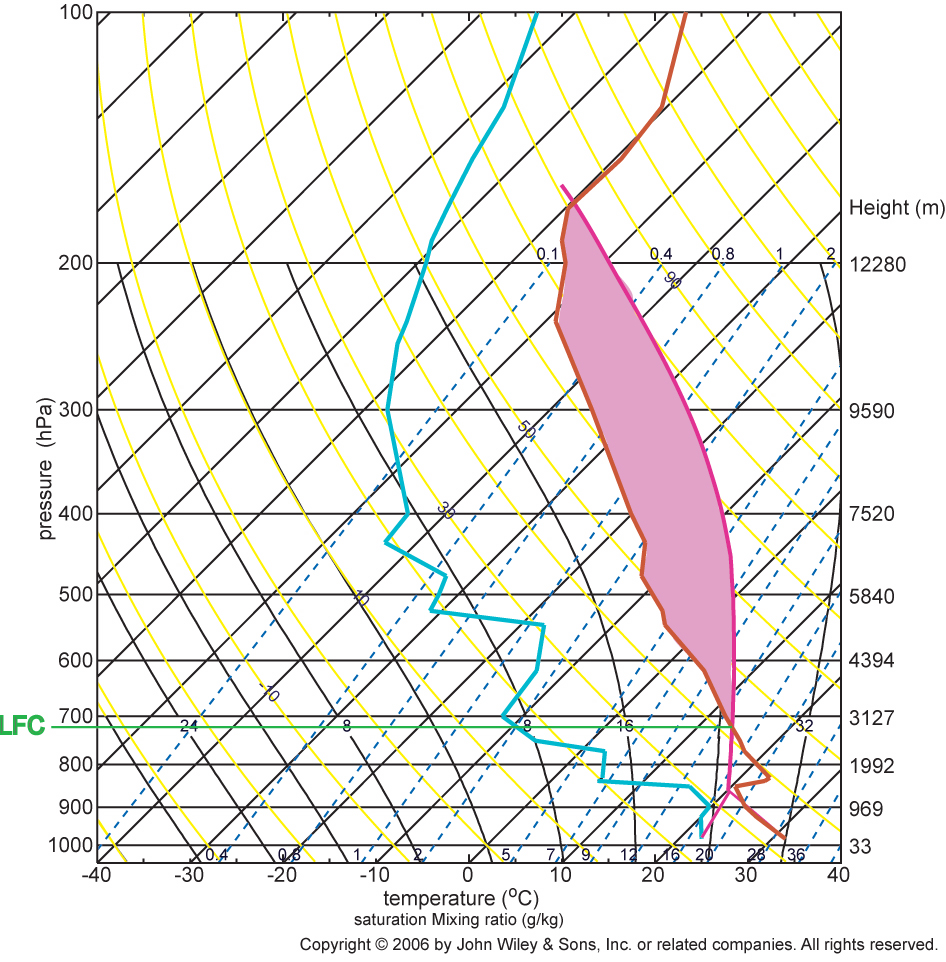
- Figure
11.2, including CAPE calculation
"Skew T log P" diagram for a sounding taken at Fort Worth, Texas,
on 5th June 2005 at 00 UTC, showing the temperature (red) and dew point temperature (cyan) profiles, and the (pink)
area representing the total convective available potential energy (CAPE) in the profile. This area is defined by the layers where
the theoretical parcel temperature, raised from the lower boundary layer, is warmer than the actual temperature. The parcel is
raised dry adiabatically until saturation is reached, and rises moist adiabatically (black curved lines) thereafter. In this
example, the CAPE represented by this area is 2953 Jkg-1. Also shown, in green, is the level of free convection (LFC),
which occurs at 706 hPa = 3053 m.
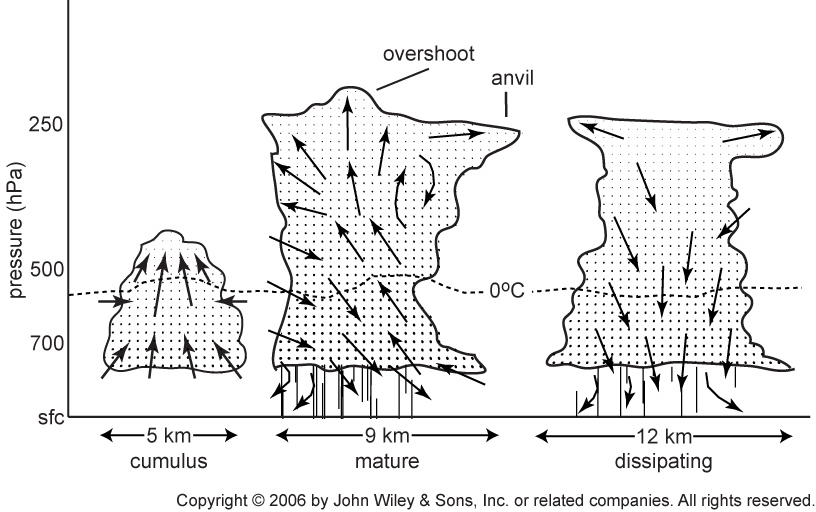
- Figure
11.3
Life cycle of a typical air mass thunderstorm cell, showing cumulus, mature,
and dissipating stages. Vertical lines at cloud base indicate precipitation (rain or hail). Arrows indicate downdrafts and updrafts
within the cloud. The top of the cloud is at the tropopause.
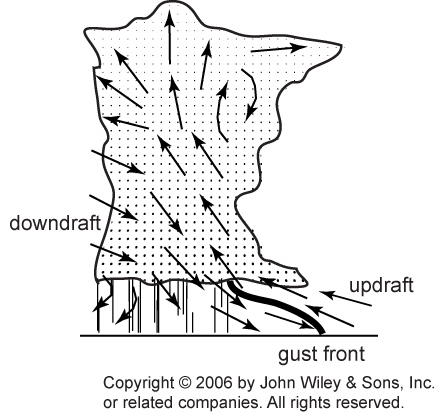
- Figure
11.4
A gust front (bold line) between the warm moist updraft and cool dry downdraft
allows the generation of new cells.
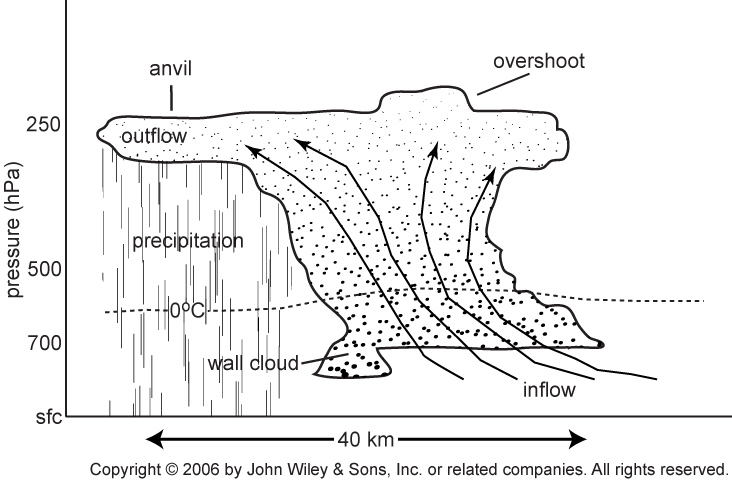
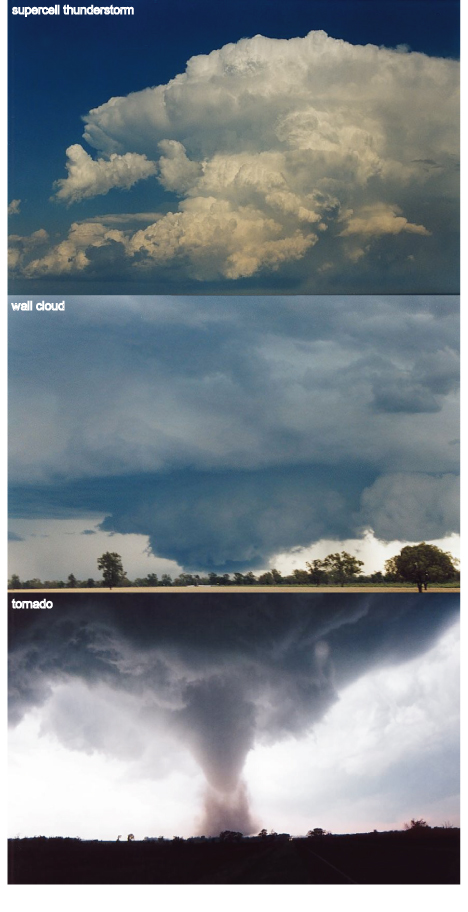
- Figure
11.5
Structure of a supercell thunderstorm
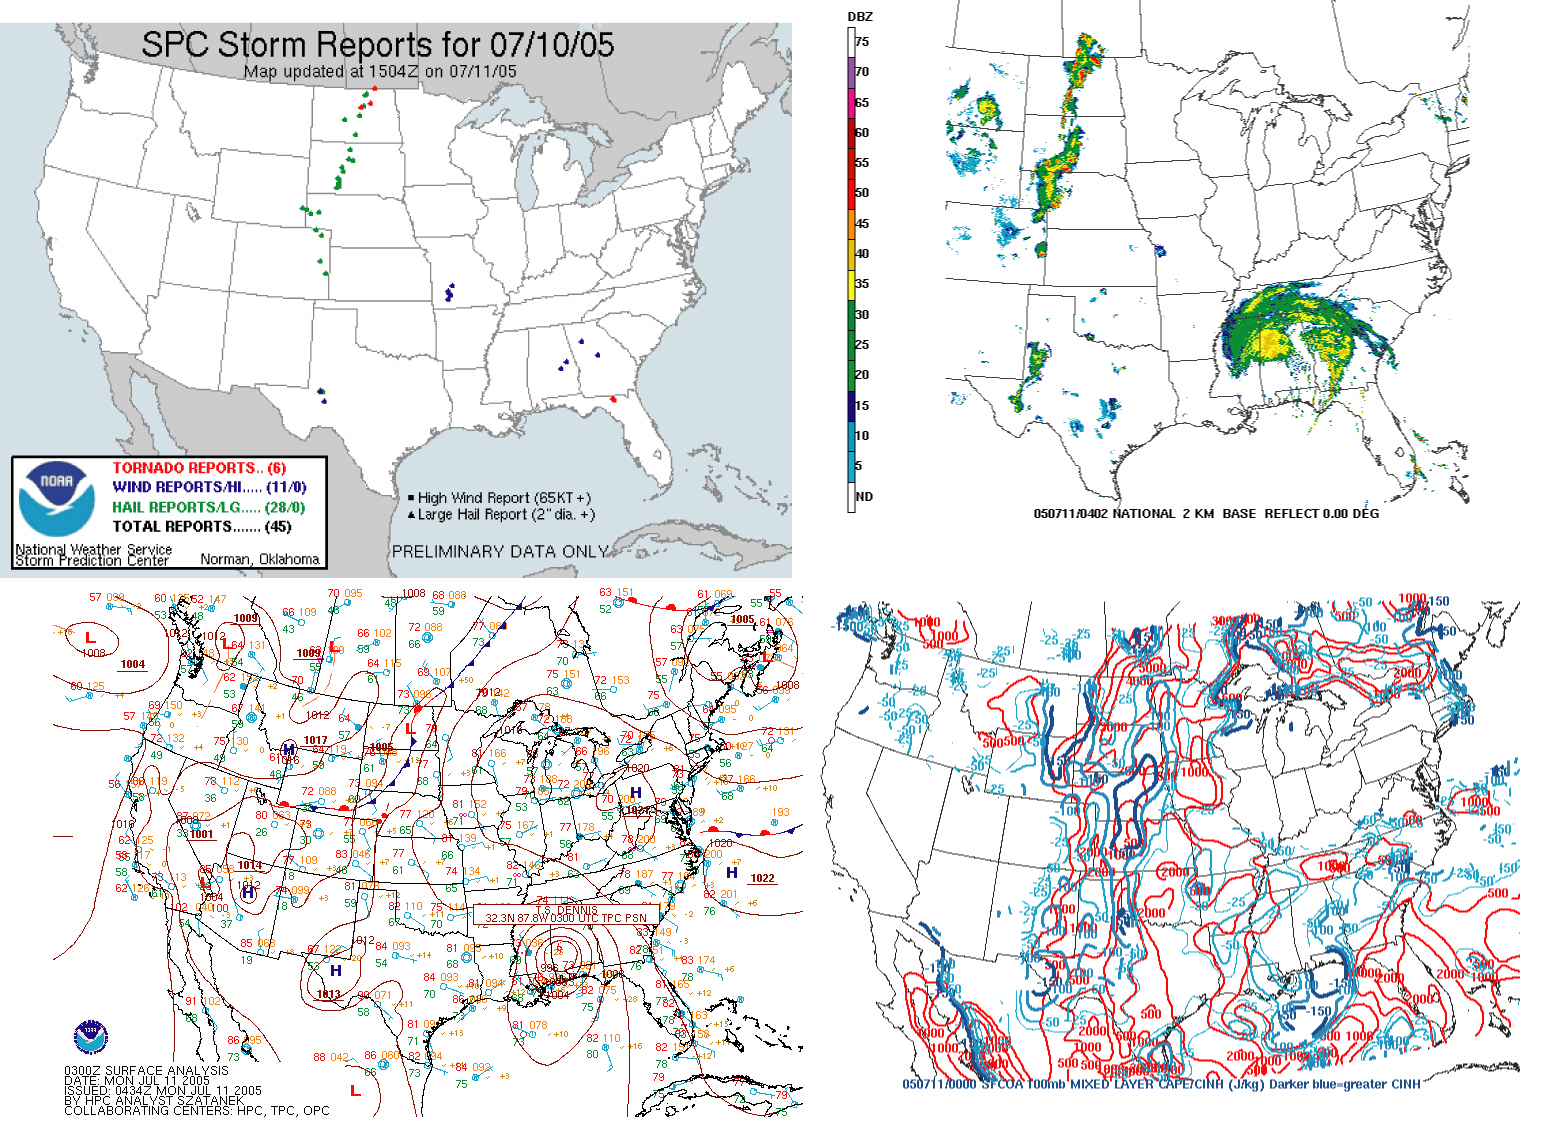
- Squall
line maps and imagery
A squall line crosses Manitoba in Canada and North and South Dakato and
Nebraska in the United States on 11th July 2005. Illustrated here are the hail and tornado reports (top left),
radar imagery (top right), surface synoptic pressure pattern showing the location of the cold front (bottom left) and a map
showing values of CAPE in red and CIN in blue (bottom right). Tropical cyclone "Dennis" is also obvious in the pressure
map and the radar signal. Images courtesy of the Storm Prediction Center in Norman, Oklahoma, USA.
- Thunderstorm
and tornado photos
Photographs courtesy Michael Bath, Jimmy Deguara and David Croan, Australian
Severe Weather http://www.australiasevereweather.com/
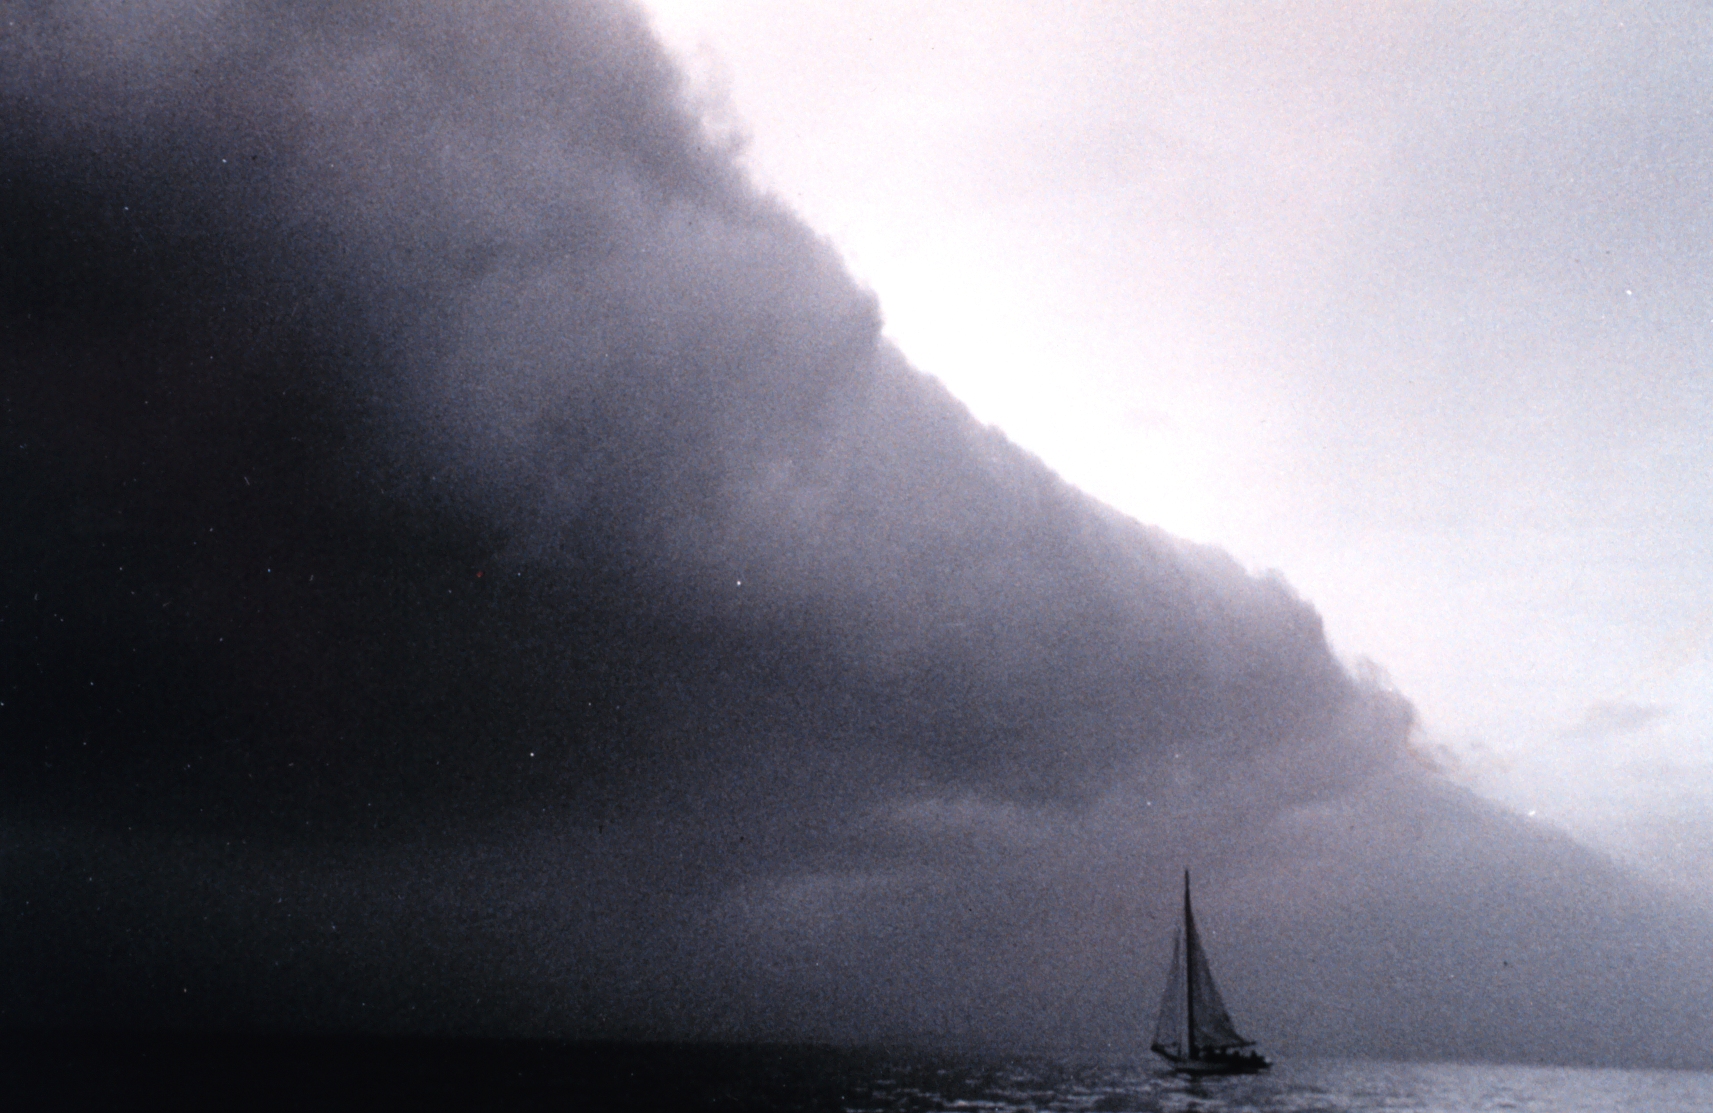
- Photo:
boat sailing into a squall line
- Film:
wall cloud and mesocyclone (Note: this is an mpg 2 file - go here if it won't play.)
|
Toolbox
CD Home
|