|
Images
Storm of 2003
Projects
|
Chapter 9: Extra-Tropical
Weather Systems
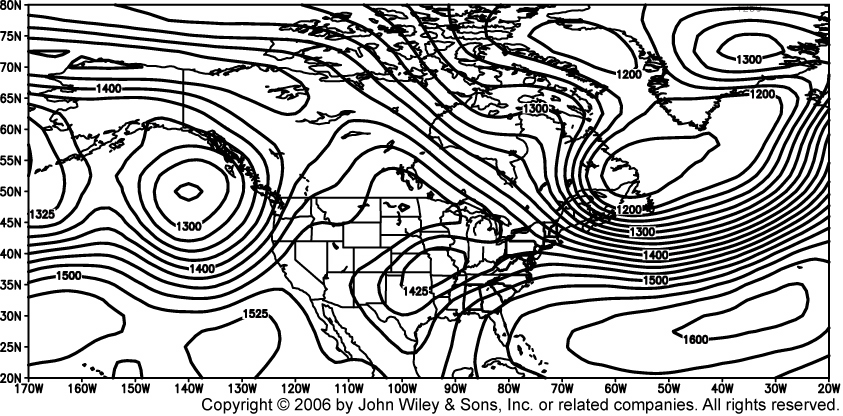
- Figure
9.1
850 hPa geopotential height on 15th Feb 2003. NCEP Reanalysis data
provided by the NOAA-CIRES Climate Diagnostics Center, Boulder, Colorado, USA, from their Web site at http://www.cdc.noaa.gov/
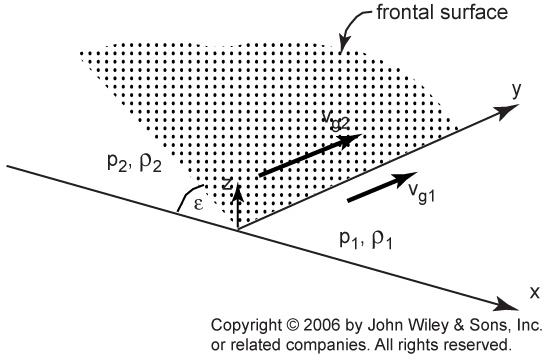
- Figure
9.2
Idealized depiction of a frontal discontinuity.
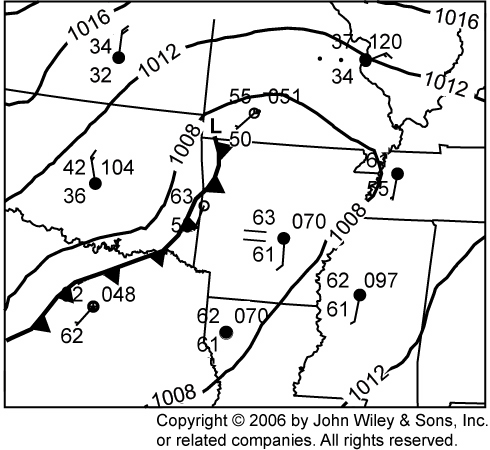
- Figure
9.3
Sea level pressure and station reports over Arkansas and surrounding
states on 15th February 2003 at 12Z. The warm front is omitted for clarity.
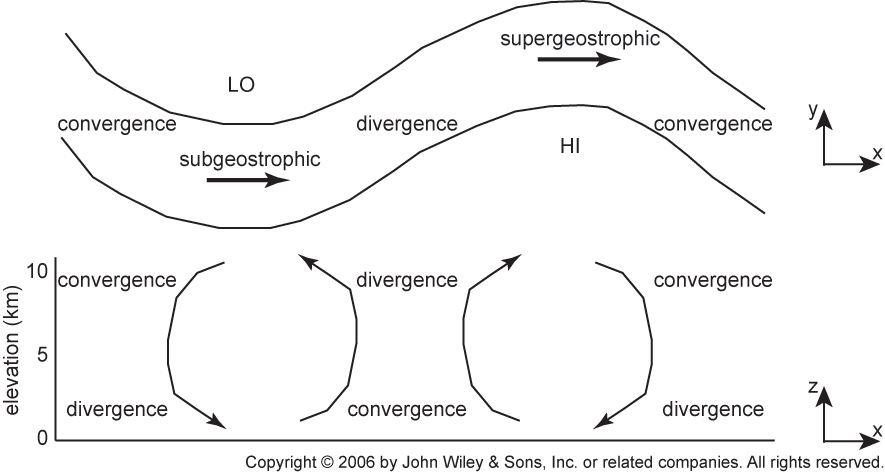
- Figure
9.4
Lines of geopotential height are related to the gradient wind and the
divergence field in the horizontal (top) and the vertical (bottom).
- Figure
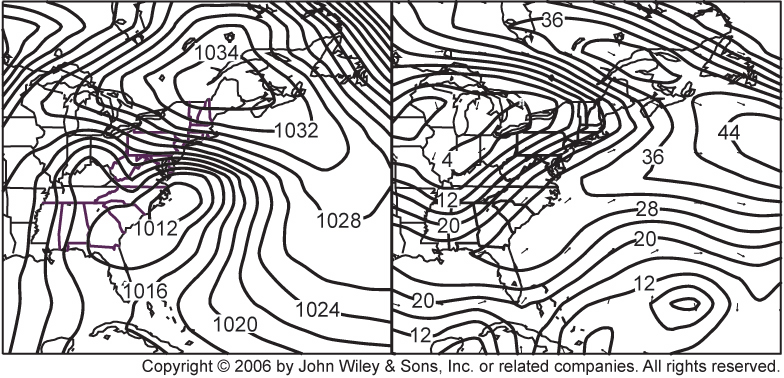
9.5
Sea level pressure (hPa, left) and 500 hPa wind shown as contours of isotachs
(lines of constant wind speed) with some indicative direction vectors (ms-1, right) on 17th February 2003
(both fields slightly smoothed), showing the location of the jet maximum in the north Atlantic, and the split jet over North America.
- Figure
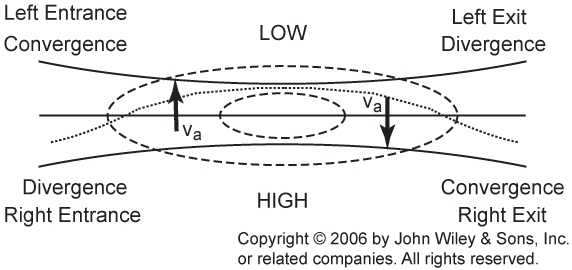
9.6
Horizontal view of the isobars (solid lines) and isotach (dashed lines) with
a typical parcel trajectory (dotted line) in an idealized jet maximum. Jet flow is in the x-direction. The four quadrants of
the jet are labeled.
- Figure
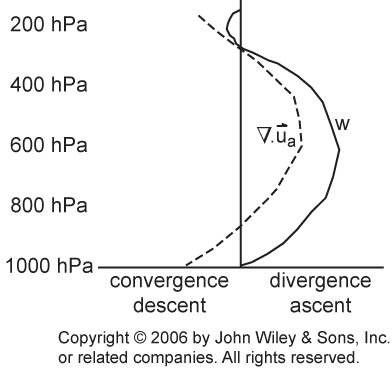
9.7
Typical patterns of divergence (dashed line) and ascent (solid line) in a mid-latitude cyclone.
- Figure
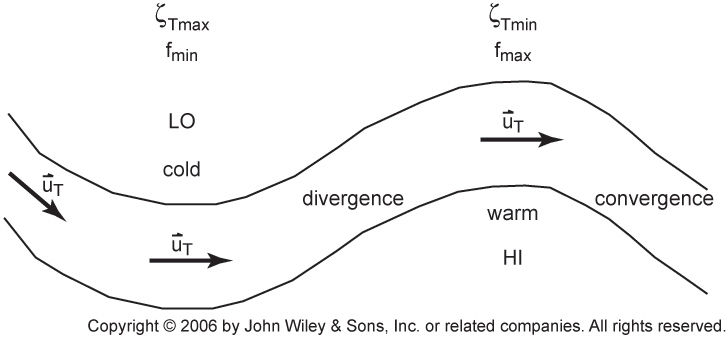
9.8
Lines of atmospheric thickness are related to the wind shear,
the "thermal vorticity", and the divergence field.
|
Toolbox
CD Home
|